Universities and colleges are accumulating significant amounts of data about student engagement, potentially enabling early warning about students at risk of failure – and the enhancement of many aspects of course provision. But how should that data be presented to the various stakeholders in institutions? Who are these stakeholders and what would be the most useful visualisations for each of them?

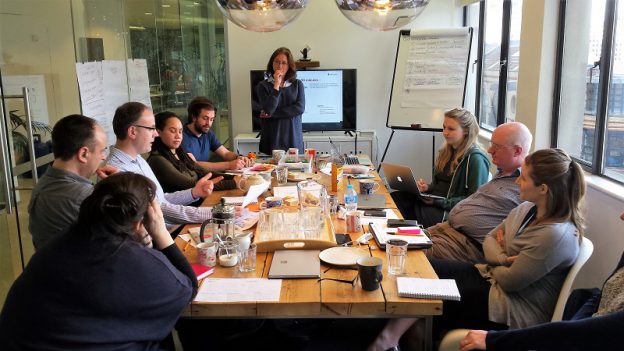
These are some of the questions being addressed by Jisc as we roll out our learning analytics architecture for educational institutions in the UK. Yesterday we met with Torchbox at their Bristol offices to work on user experience design for Jisc’s Data Explorer. This tool is not aimed at doing everything or competing with the more sophisticated data crunching tools emerging for learning analytics. It’s being designed to enable institutions to explore the data accumulating in their learning record stores, to perform simple correlations, and to gain experience before investing in a fully-fledged system.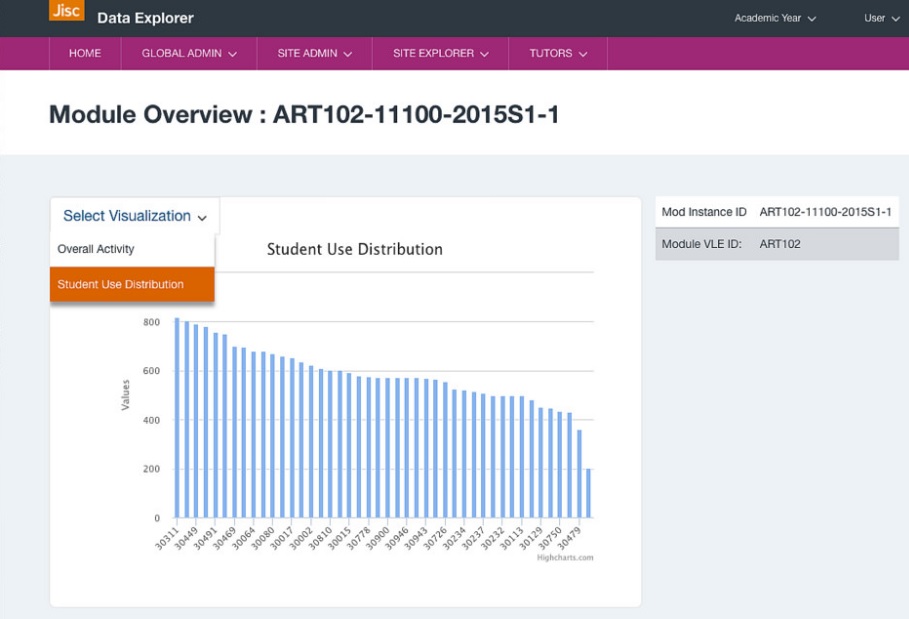
With the help of Torchbox and colleagues from two universities (Gloucestershire and Newman) we looked at user goals, behaviours and experiences for a range of user types, as well as some of the associated organisational goals and barriers.
Out of this emerged two distinct hierarchies of roles:
- Modules: module leader / tutor -> subject / course / programme leader -> management
- Pastoral: personal tutor -> senior tutor -> head of tutors
A third grouping contains a number of roles, not necessarily arranged in any hierarchy:
Central support: e.g. librarians, IT, learning technologists
Students have their own visualisations through a separate app, Study Goal, which itself went through an extensive consultation and design process. However one use case is for personal tutors to discuss the dashboard they have on an individual student with them during a meeting as a way of framing the discussion.
Modules hierarchy
For each module there will be a leader who needs data on the students taking that module, resource utilisation etc. Modules are grouped into subjects, courses or programmes, led by someone who is likely to require aggregated data from the component modules but may also want to drill down to module level data. The management layer above that will be interested in further higher level aggregations, again perhaps requiring to drill down to lower levels.
Pastoral hierarchy
Personal tutors will require information on the individual students they’re responsible for and may be interested in aggregated data on all of them. A senior tutor role exists in many institutions, someone who is responsible for multiple tutors and will want to see data at a higher level. There may also be a head of tutors, responsible for the whole process, and therefore interested in further aggregations of data. Again there may be requirements for each of these to be able to drill down to lower levels of data.
Central support
What we termed “central support” is less a hierarchy than a collection of different roles for staff in different parts of the institution, generally providing support across the board to students and/or staff. These may include librarians, disability support staff, counselling staff, IT support, learning technologists and academic designers.
One challenging design issue is that these roles will be constituted differently at each institution. They’ll also have a variety of names. Can we come up with generic enough roles that they can be mapped easily onto existing institutional structures and renamed as required in each institution? Or do we work on collections of lower level roles and allow institutions to form their own higher level groupings, perhaps building a series of default roles for them to select from?
I suspect this will become clearer quite rapidly as we work on it. Torchbox is now setting up interviews with stakeholders at institutions to test out and refine the ideas we had yesterday before we build them into the Data Explorer tool in order to provide the most useful visualisations to staff. Stay tuned for further updates on this blog.