Degree course accreditation within higher education (HE) has never been so important. In a world where so many courses now exist, students rightly want to select the right courses for their future career needs. Accredited courses can bring additional credibility and confidence that students will graduate with the skills they need within their chosen professional discipline to thrive in industry and the next stage of their lives.
But what about the organisations tasked with selecting the right courses within their subject areas to accredit? Not only will their decisions inform many students’ critical study choices, but they also have the future strength of their entire professional disciplines at stake. That may sound dramatic, but it’s true. Professional and regulatory bodies need to ensure that the supply chain of graduates feeding their industry is of the required standard and high-quality, accredited courses delivering compelling learning is the main way of doing that. A few misjudged decisions could easily lead to the next generation of engineers or nurses missing out on the best possible learning and development experience. Take a moment to imagine the societal consequences of that in critical industries that we all rely on every day. When the decisions are this important, degree course accreditors can no longer rely on anecdotes or taking chances – they need to be evidence led so they get it right each time, every time.
This week, Jisc data analytics launched a new analytical report to give HE course accreditors the tools they need to properly inform their course portfolio decisions. The Degree programme accreditation report provides a tailored, comparative analysis of students studying on their accredited courses at UK HE providers against those on similar non-accredited courses alongside a subject benchmark for wider context. This means accreditors instantly know if they are accrediting the right courses as soon as they finish reading the report.
We have previously produced this type of analytical insight through our HE data consultancy service so appreciated the need to design something we can share more widely and at speed for others to benefit from. Having seen the example report based on anonymised data, I can instantly see why the data and analysis contained within it will permanently change the way accreditors make decisions. I’ve picked out three key reasons why below.

1 – Data helps accreditors to deliver fair access for every student in their profession through widening participation
Ensuring equal opportunity and diversity within a subject area is a key goal for regulatory and professional membership bodies responsible for course accreditation, as well as for wider society. Nobody should face barriers to study based on their gender or ethnicity for example, and professional bodies keep key indicators such as the gender study gap under close review to widen access and enhance diverse graduate recruitment for the businesses they support.
The Degree programme accreditation report dedicates an entire section to examining widening participation on accredited courses against non-accredited comparators as well as the wider subject area. This delivers objective, unbiased evidence for HE accreditors to use to inform their diversity decisions and two example charts from it are shown below.
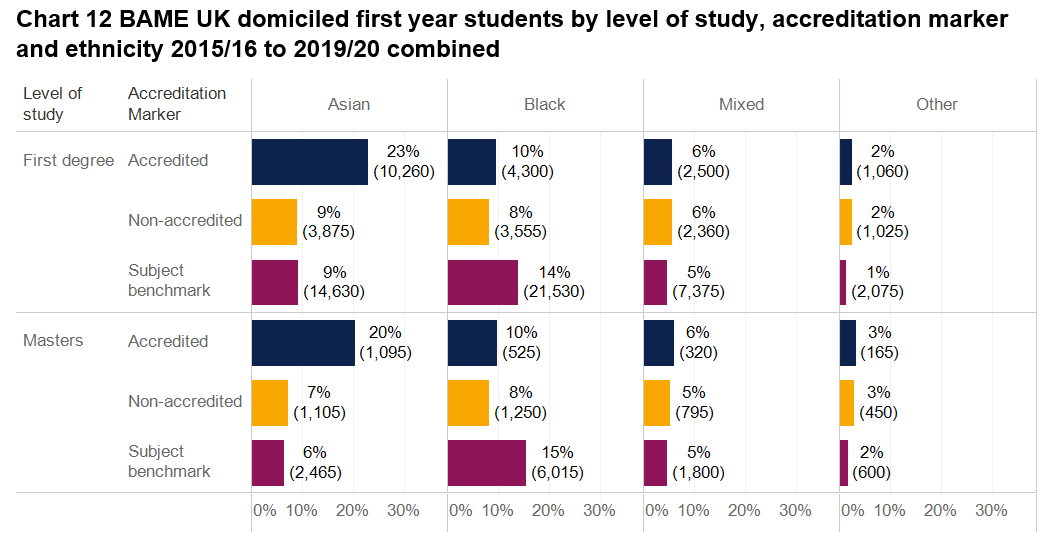
The above chart taken from an example report looks at the number and proportion of Black, Asian, and minority ethnic (BAME) students entering accredited and non-accredited courses over time. It’s instantly clear that there are some significant differences with more Asian students entering accredited, first-degree and masters courses than the comparators and overall subject benchmark. Having said that, it’s also clear that the accredited courses are performing below the subject benchmark in the recruitment of Black students, so that would be a piece of intelligence that would be investigated further and then likely addressed through targeted strategies.
In this second chart, we can see a significant gender study gap in the overall subject and in first degree, accredited courses which doesn’t exist in non-accredited comparators. That would ring alarm bells for accreditors and this key insight would prompt further investigation.
2 – Data reveals the complete outcomes narrative from those not completing their studies to those thriving
There are two key perspectives when analysing course outcomes. Employers often want to know how many qualifiers achieved a first-class honours or upper second, but accreditors also need to look at the proportion of students not completing a course to gain the complete picture.
The Degree programme accreditation report does all that hard work – identifying completion outcomes for both accredited courses and those that could become accredited in the future. Not only are all these comparative statistics provided separately, but they are also summarised neatly in one incredibly insightful dashboard shown in the example below.
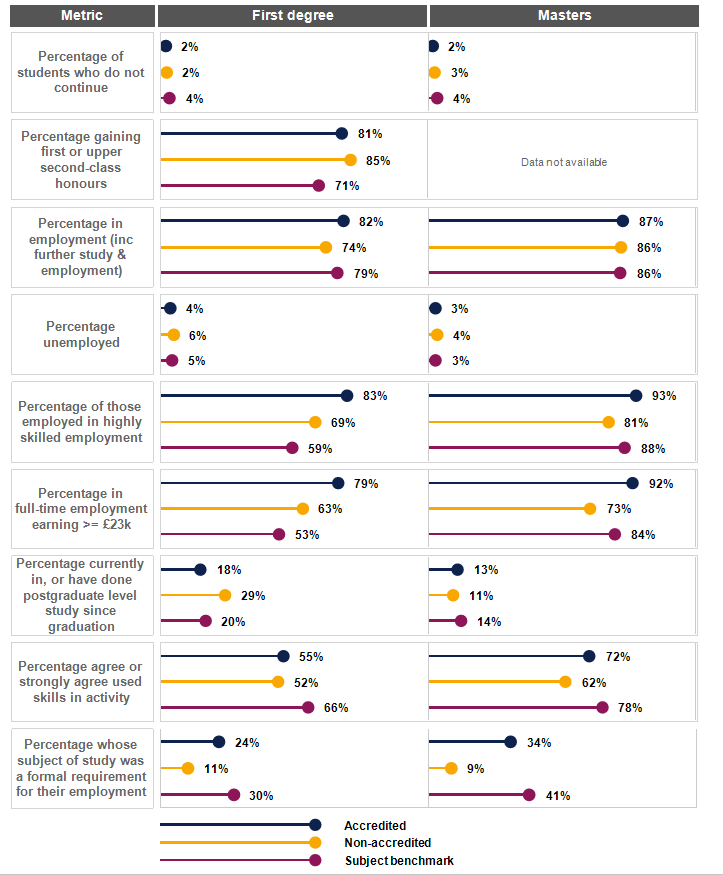
The level of intelligence provided in this one dashboard shouldn’t be underestimated and will likely form an integral part of a HE accreditor’s toolkit for many years to come.
3 – Data shows accreditors which graduates are securing highly-skilled jobs and strengthening their industry supply chain
Part of what makes a great course is that it prepares students with the skills they need to succeed once they graduate – regardless of whether they go into further study or employment. Professional and statutory bodies are looking to strengthen their professional discipline and ensure that their future workforce supply chain is robust. A key way to do this is through degree course accreditation and the Degree programme accreditation report provides the vital graduate employment and further study data needed.
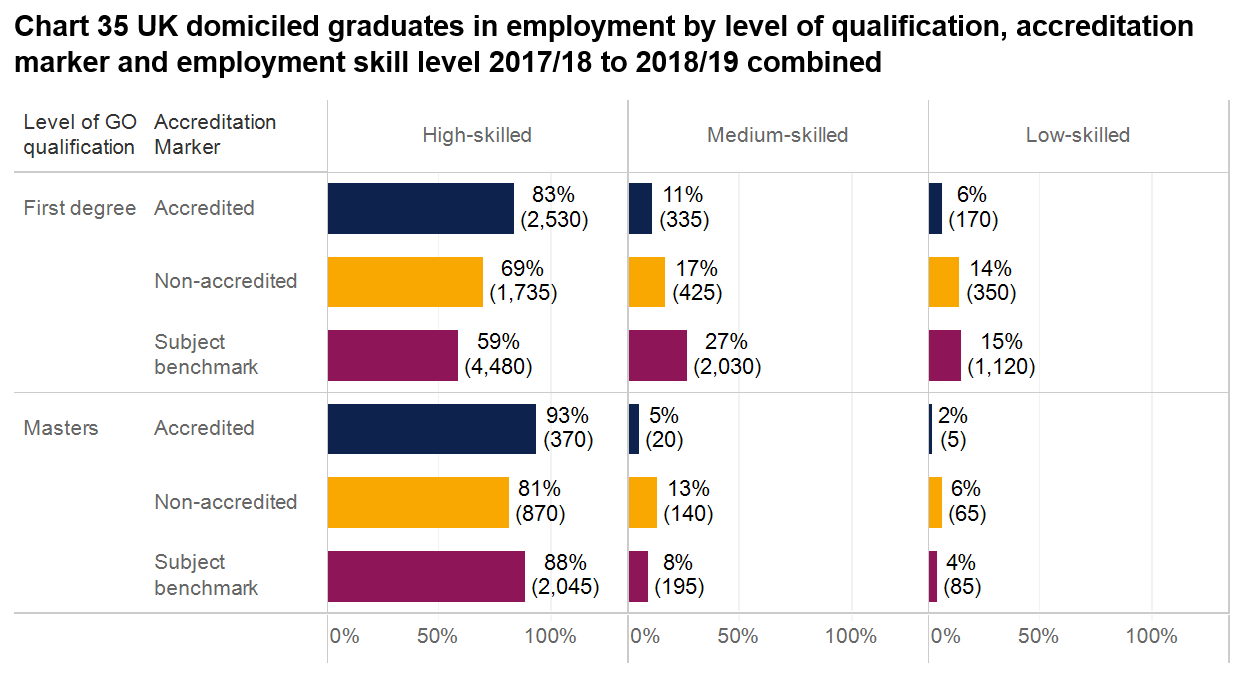
The chart above provides data from the new Graduate Outcomes survey taken annually 15 months after graduation and first published in 2020. It presents a graduate employment profile showing those in low, medium and highly- skilled jobs from both accredited and non-accredited courses. This allows readers to identify the number and percentage of graduates entering the workforce at different skill levels and the accredited programme in the example above performs particularly well with a higher proportion of graduates going into highly-skilled employment.
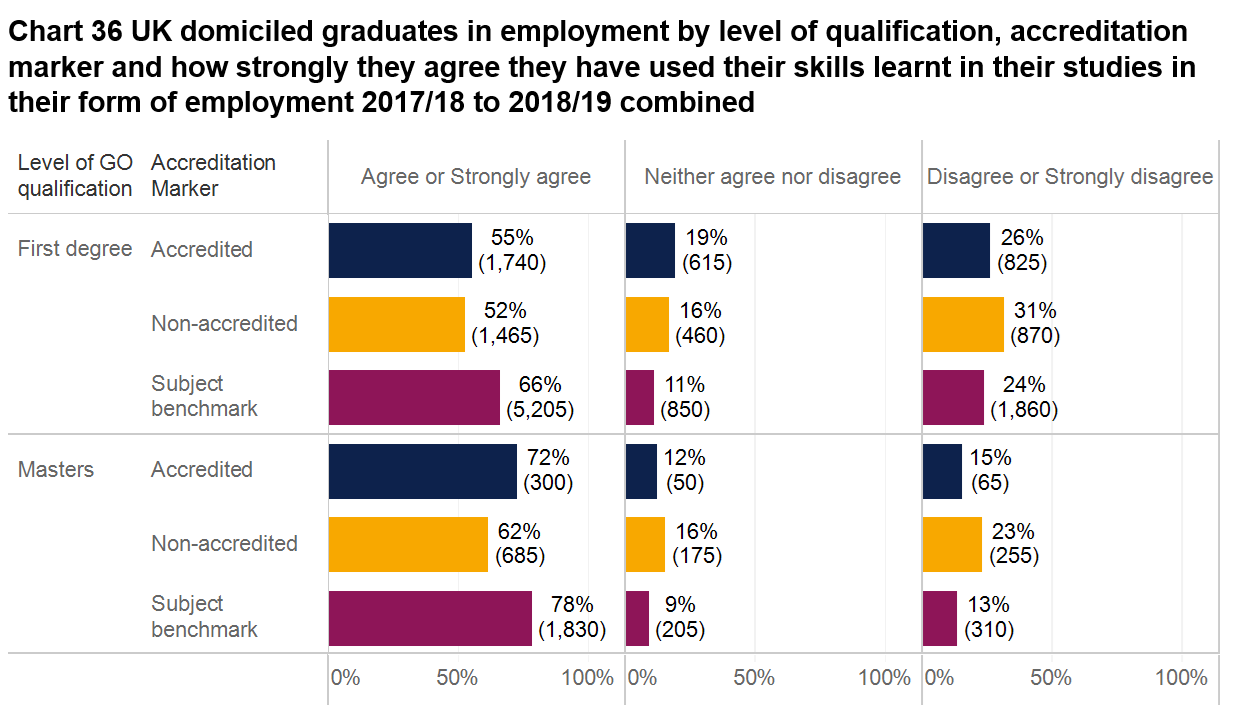
The chart below perhaps provides even richer insight for accreditors, asking former students whether they used the skills they learned in their studies in subsequent employment. This is one of the most important pieces of data that an accreditor is likely to see as it links the course directly to whether it prepared the graduate for their chosen career. Students want to know how well they will be prepared for work and course accreditation decisions must factor this in.
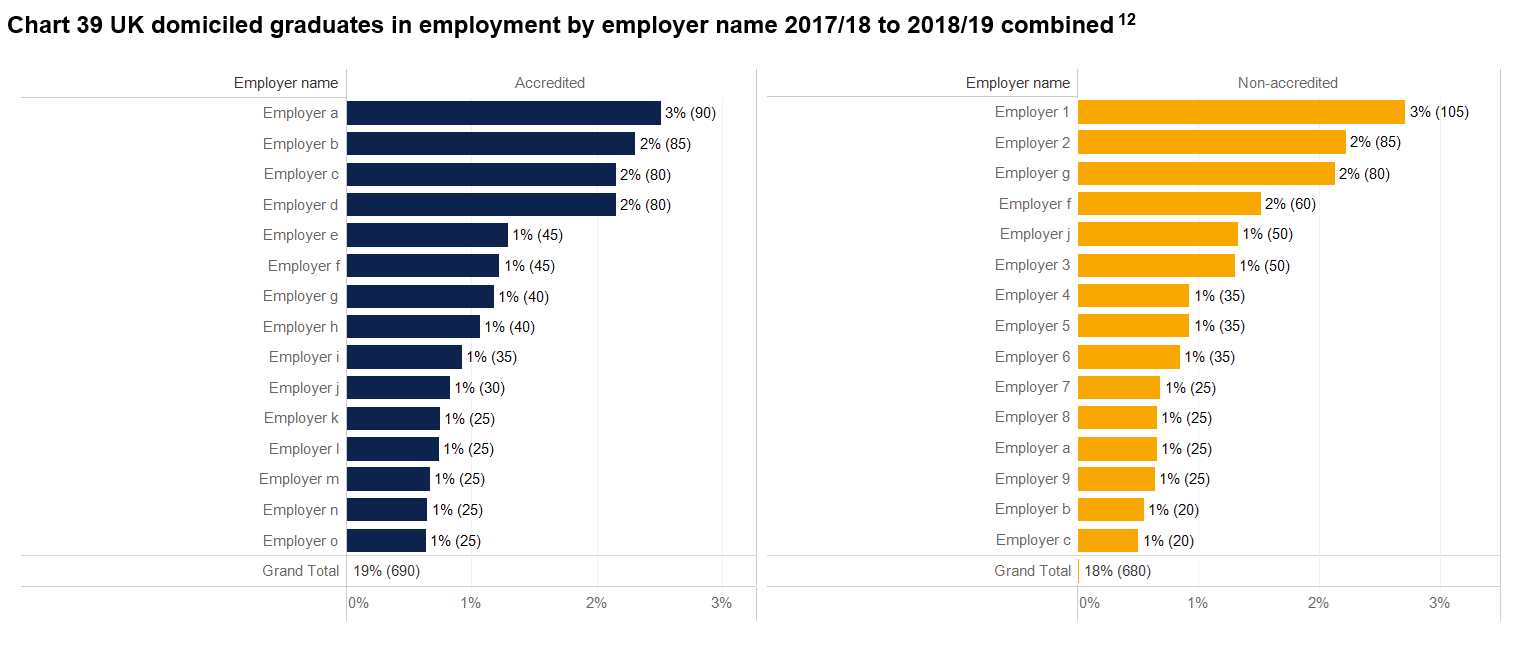
The Degree programme accreditation report includes employer analysis, as shown in this final chart below, detailing the employers that graduates in a particular discipline went on to work for. This is in addition to similar charts for the industries and occupations they were in at the point of the Graduate Outcomes survey. This finalises the outcomes picture for an accreditor as they can see where graduates from accredited courses went on to work as well as their salary and employment location. This comprehensive overview is also available for non-accredited courses and allows for the future pipeline of industry talent to be measured. It completes the evidence portfolio for data-driven accreditation decisions.
Let us help you make the right decisions for your accreditation programme
The Degree programme accreditation report contains over 50 pages of data and analysis which is personalised for your accreditation portfolio and subject area. It uses the latest diversity, outcomes and employability data such as that from the new Graduate Outcomes survey and multiple years of trusted, HESA data (Jisc are HESA’s official data processor) where appropriate to increase your confidence in its conclusions.
If you’re ready to make data-driven course accreditation decisions, get in touch by completing this form, to discuss your requirements and quote ‘Accreditation21’ in the discount code field to receive 5% off your first report. We look forward to supporting you with your accreditation decisions.