
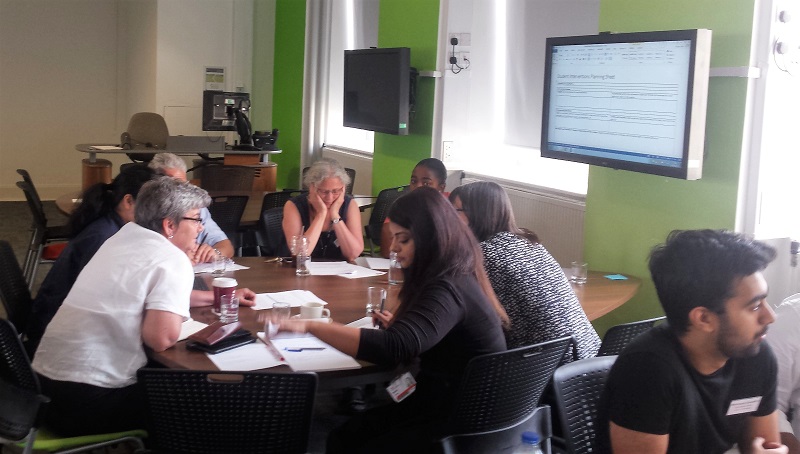
At our Planning Interventions workshop at Aston University last week we spent the morning looking at interventions with individual at-risk students. This post reports on the afternoon session, where we examined the use of learning analytics to enhance the curriculum.
Participants were given several simulated analytics outputs relating to the first year of a degree programme. Data concerned both the programme and individual modules, and included:
- VLE activity for one module showing access of pages, quizzes and discussion forums
- A graph of VLE activity correlating with grades for the programme of study (included below)
- Attendance against achievement
- Assessment dates and activity (included below)
- The prediction of students at risk of failure over the year
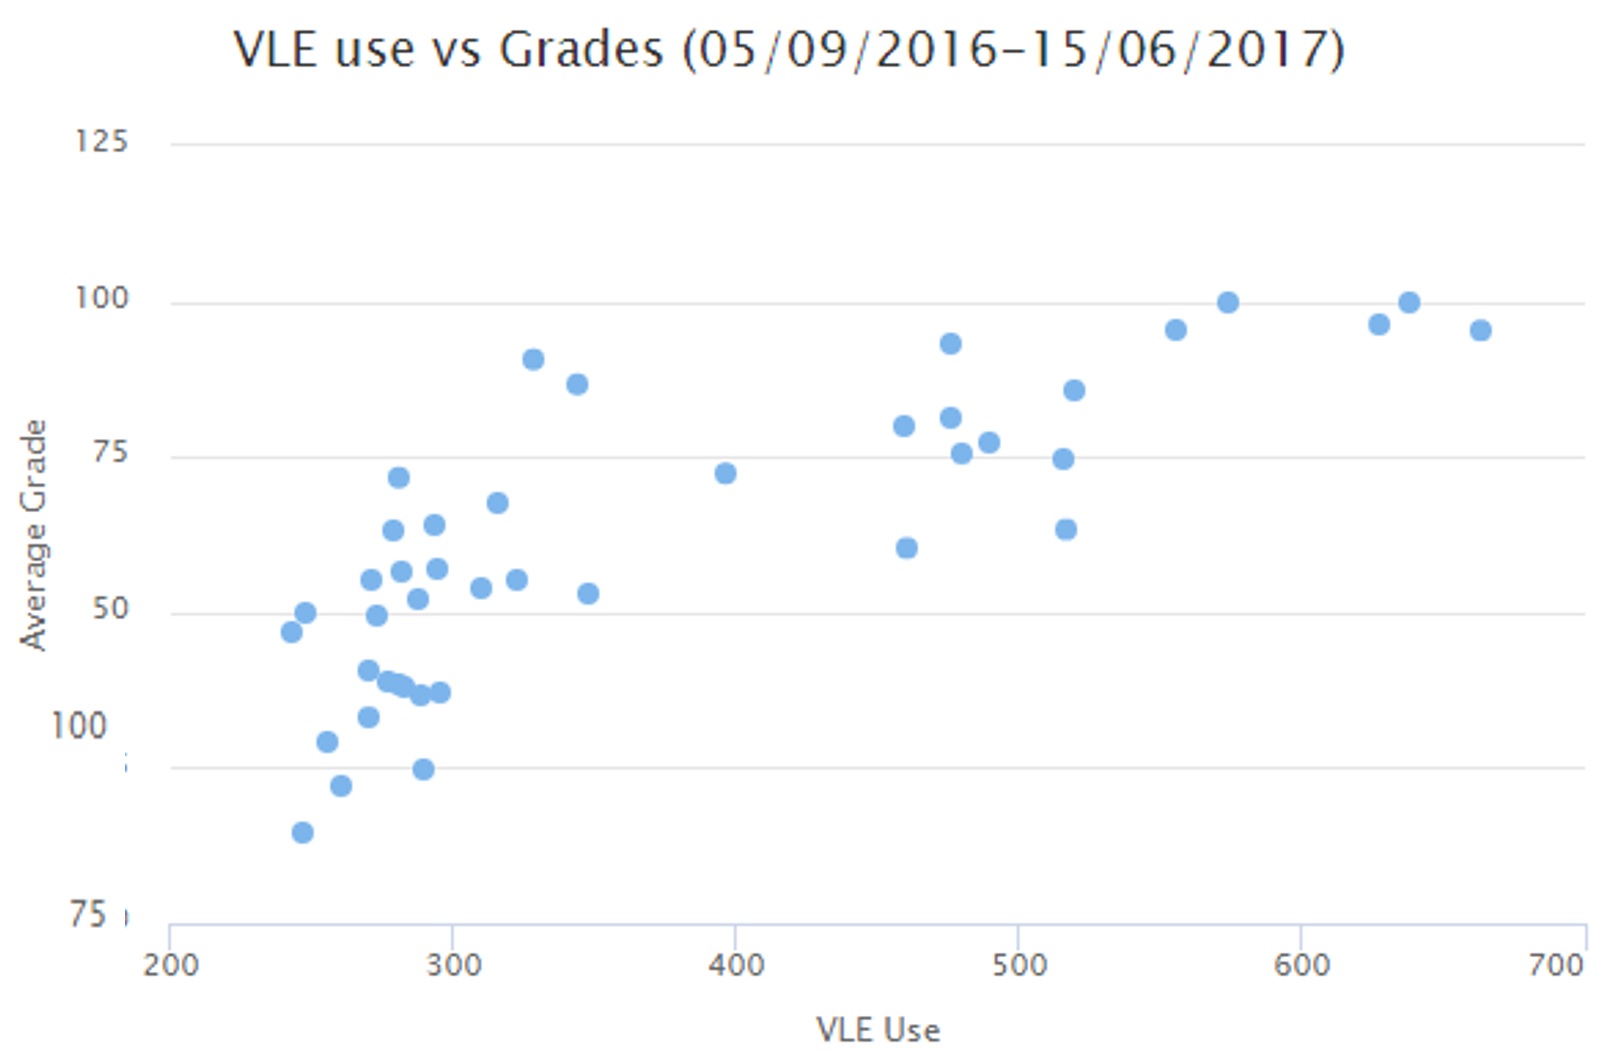
This graph shows a correlation between VLE use and performance in assessments.
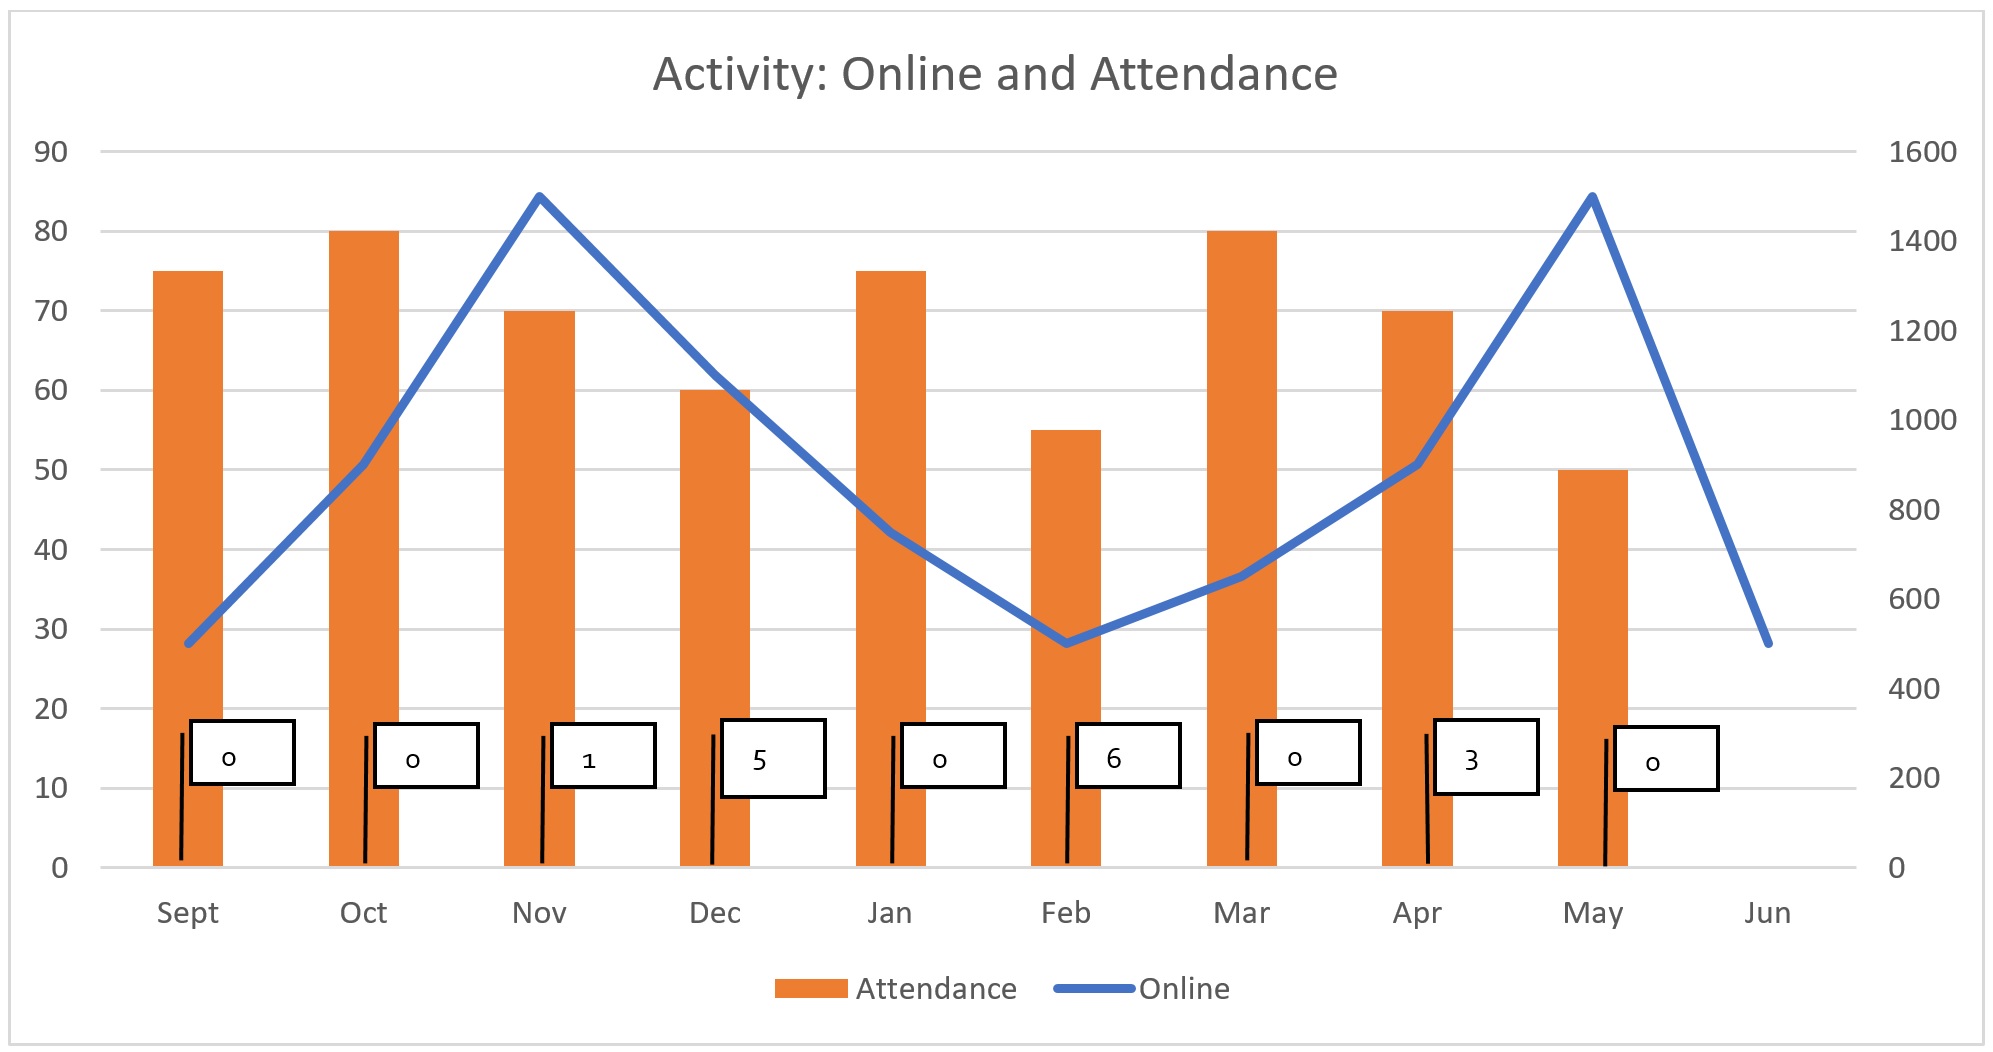
This graph shows online activity and attendance at classes for the group during the first year of the programme, with the number of assessments required to be submitted per month.
Groups were asked to review the various graphs and tables and then develop an intervention plan addressing:
- Questions – what should we be asking about the effectiveness of our curricula?
- Data – what data should we collect to help answer these questions? Is the data provided useful?
- Stakeholders – who are the main actors who can adapt the curriculum?
- Interventions – what changes might you make to enhance the curriculum and what would you expect to happen?
- Adoption – what will staff do differently? How will they be encouraged to change their working practices?
- Evaluation – how will the success of the enhancement be evaluated?
- Sustainability – how do we make it effective and on-going?
Questions
It’s a realistic scenario that staff are increasingly going to be presented with a selection of different visualisations of data about engagement with learning activities, grades etc. – and then have to see what questions these raise about the effectiveness of the curricula they’ve put together.
One of the most glaring issues with the simulated programme we presented was the bunching of assessments. “Which clown designed the assessment schedule?” asked one group. They felt that this was quite clearly driving attendance and online activities (or the lack of them). Another group wanted to know more detail about the assessments – were they formative or summative and was the feedback timely? It was also noted that a third of students hadn’t engaged in the quizzes at all.
There was a desire for greater detail about VLE use in general. Which tools are being used and which appear to be effective?
One group asked: “We observe that average grade correlates highly positively with attendance so how do we go about optimising consistent attendance patterns?” They also wondered how higher participation could be achieved in forums and quizzes as VLE engagement is correlated too with better grades.
We do of course need to keep reminding ourselves that correlation is not the same as causation. However if the pattern of a successful learner includes high engagement with the VLE and good face to face attendance, then we can at least attempt to design curricula which encourage this and advise students of the importance of engagement. We can probably assume that overall performance of cohorts will then improve if participation in the learning activities we’ve designed improves – though there are of course lots of factors to consider such as other aspects of the curriculum not standing still, different staff involved and new cohorts which vary in multiple aspects.
Another problem identified was low attendance in a module requiring studio attendance (it was a ceramics degree). The group I was in speculated as to whether attendance was being recorded accurately, or perhaps that students would do their studio work in a few long sessions rather than lots of short ones, the data thus suggesting lower participation than the reality.
One group noted that online engagement was low and asked “Why are we struggling to engage students with online activities? Should the course even be online? Is the VLE the best forum to share practical application? [it being a ceramics degree]”. Other fundamental questions people thought should be asked included “Does the teaching matter?” and “Does the VLE make a difference?”
Data
We asked the groups whether the data given to them was of use and what else should be collected to help them answer their questions about the curriculum. There was a wide variety of suggestions here.
Several mentioned the need for a greater breakdown of data on VLE activity, particularly the timing of access to content, quizzes and forums, and the duration of visits. Seeing patterns of use of quizzes, including numbers of students who’d accessed them multiple times, was also thought to be potentially useful – as well as further data on the scores achieved. Also, further detail on the nature of the assessments e.g. whether they involve group work was considered important.
Another group wanted to be able to drill down to see individual student data when required, as well as a cohort view.
Final module marks for the cohort along with retention and progression data were thought to be necessary pieces of information as well. Student satisfaction data would help to discover why some modules have much better engagement than others. Further insight could be obtained from focus groups asking questions such as “Why are we struggling to engage you with online activities?” or attempting to discover whether IT literacy is an issue.
Some groups suggested additional visualisations e.g. showing the relationship between quiz engagement and course grade, and between VLE engagement and attendance. Do those who attend less catch up at home by watching lecture videos, for example? Does that compensate for missing out on face to face contact?
Stakeholders
Students, academic staff, associate deans, programme directors, module leads, tutors, learning technologists, external examiners, alumni, employers, professional bodies and other institutions sharing best practice, were all suggested. One group noted the need for students to be active here rather than passive – another proposed that the staff-student consultative committee could help provide ideas. Students could be asked, for example, “What would the VLE look like if you had a hand in it?”
Enhancements/interventions
Several groups mentioned addressing the issue of assessments being clustered too closely. Assessments could be introduced earlier, to help students get used to them, and to provide more timely feedback to staff on student engagement. The assessment load, in this example, should clearly be spread more evenly across the year.
The learning design should ensure that online activities are more clearly linked to assessment, which should encourage better take-up of forums and quizzes. An early process to optimise student engagement with the VLE may be necessary. Study skills training at the start of the programme which shows students the most effective ways to use online learning might also help.
The data might even raise questions as to the effectiveness of the content on the VLE: is it “rich, dynamic, engaging and accessible?” The quality of the VLE platform itself might even be questioned. It may also be that there are too many quizzes and forums, and that they could be consolidated somehow – or non-online alternatives could be considered.
Adoption
In this section we were hoping that the groups would think about what staff would need to do differently to implement the use of analytics to enhance the curriculum. How would they be encouraged to change their working practices and what roles would be involved?
However the two groups which got to this point seemed to be thinking more about how to improve use of the VLE in particular.
One group suggested working with students as a partnership to redesign the VLE, and training staff in instructional design. The other suggested flipping the classroom, and moving from tutorials and seminars to a more personalised form of learning.
If use of the VLE is considered important by the institution then showing staff the correlations between its usage and assessment performance may be helpful in making the case that they should be using it more.
Evaluation
Some participants wondered what we should be evaluating here: the success of the programme or uptake of the VLE? If our intervention aims to increase VLE uptake because we see a correlation between that and performance then measuring VLE use before and after the intervention would be important. Likewise reviewing data on attendance may help to evaluate the success of the intervention. Comparisons could be made with historical data on attendance, engagement and satisfaction to see if these have improved.
Ultimately, reviewing the grades of future cohorts or the marks in individual assessments may give an indication of whether the intervention has been successful.
Sustainability
Pockets of good practice can disappear with individuals: one group suggested attempting to share ownership across the institution, and to capture any lessons learnt. Ensuring that the student voice is heard, and that there’s a process of feedback and iterative review were also thought to be vital.
Conclusion
Participants worked hard and seemed highly engaged with the activities all afternoon. There is a strong desire to see how we can use the rapidly increasing sources of data on student activity to develop curricula based on evidence of what works. Most universities and colleges are only beginning to do this but staff skills in interpreting such data and updating the curriculum as a result are, I believe, soon going to be essential. We now have the blueprint for a workshop which we can build on for institutions interested in using learning analytics for more than just addressing student retention.