 This is a guest blog by Lindsay Pineda, who is currently a Senior Implementation Consultant for Unicon and has a rich background in learning/predictive analytics. In her previous position, she focused on helping to develop, implement, and execute a proprietary predictive modeling technology that has proven to be successful in predicting student course persistence on a week-to-week basis. Lindsay has immersed herself in learning/predictive analytics research, practical applications, and implementation. Since coming to Unicon, she has been working with institutions to provide Learning Analytics solutions, both technical and nontechnical, and has had a focus on visiting institutions onsite to provide Readiness Assessments. She helps institutions work through issues of change management, resourcing, challenges, and concerns relating to the adoption of Learning Analytics.
Identifying Organizational and Technical Patterns
Key Takeaways
- What are the top learning analytics challenges among institutions in the UK?
- What organizational and technical considerations need to be addressed to pave the way for a successful learning analytics initiative?
- When it comes to learning analytics, are institutions ready?
 Over the past year, I had the pleasure of traveling throughout the UK with a colleague, Patrick Lynch of the University of Hull, jointly conducting Readiness Assessments as part of Jisc’s learning analytics project (see “Useful Reading” section below for more information). The institutions varied in student population and demographic representation, and were located across the UK. Institutions included both HE (higher education) and FE (further education), with private and public institutions represented.
Yet with all of the diversity between institutions, they shared many similar organizational and technical readiness trends. My hope is by sharing these trends in the aggregate, institutions interested in learning analytics (whether through Jisc or through another means) will find that they are not alone in their concerns or challenges, organizationally and technologically.
The Readiness Assessment process, outlined below, is designed to be collaborative and conducted onsite with a variety of key stakeholders across the organization. Typically, the onsite visit is three days long and consists of larger-scale meetings involving several departments, smaller-scale meetings including focus groups, and one-on-one meetings with individuals. At one institution, for example, we gathered the key stakeholders to facilitate a discussion using activities designed to help the participants generate productive and collaborative conversations.
 Some questions we asked participants were:
- How do you think learning analytics will impact your daily job activities?
- What policies, procedures, and practices do you believe will need to adapt or be created to accommodate the adoption of a learning analytics solution within your institution?
- What ethical considerations are there to using the data to provide guidance to students?
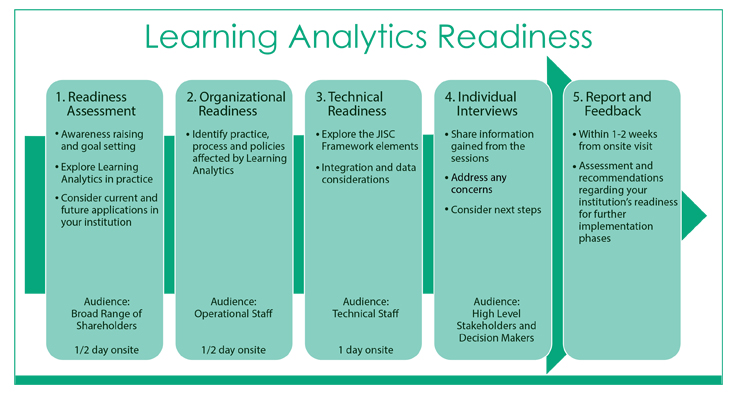
 We typically spent one day doing larger scale trainings/ activities and two days meeting with organizational staff. Meeting topics included organizational structure, policies, procedures, and ethical concerns. We met with technical staff to discuss data management practices, integration, and maintenance challenges/ concerns. With senior level leadership, we provided them an opportunity to express their concerns, feedback, and overall goals for the institution. We also conducted focus groups with students (of varying degree levels and academic focus), academic staff (including teachers), and professional staff (including academic advisers, strategy groups, and learning/ teaching staff).
After the onsite visit, a fully comprehensive report was delivered back to the institution that contained all observations, direct feedback from participants (in an anonymous manner, collected as quotes without assignments of individual names), both qualitative and quantitative measures, and recommendations of next steps.
Institutions provided positive feedback on the Readiness Assessment, reporting it was extremely beneficial in bringing together individuals from different departments throughout the institution. This allowed the departments (e.g., learning and teaching, academics, senior leadership, students, IT, etc.) to speak freely and openly with each other about their concerns; the ways in which they might use the information gained; how one department’s activities can and do affect another; and more. Each institution received a comprehensive report outlining the information gained within the sessions to help illustrate the institution’s current state and the steps needed to get to a place where learning analytics could continue to be explored.
In our discussions, we used the Unicon Readiness Assessment Matrix (closely coordinated with the EDUCAUSE Maturity Index) to assess the readiness of institutions. The matrix rates institutional readiness based on six criteria: Data Management/ Security, Culture, Investment/ Resources, Policies, Technical Infrastructure, and IR (institutional research) Involvement. These criteria provided an outline for the qualitative elements discussed within the comprehensive report and throughout the onsite visits.
Our readiness process also provided a forum that enabled institutions to collaborate on ways to overcome the concerns and challenges that they identified. A summary of the most common challenges and concerns, “real-life” examples, and potential solution suggestions (directly from institutions) will be covered in a series of future articles, beginning in March 2017.
Trends: Organizational
“The institutions discovered discrepancies in how staff and leadership perceived management of institutional policies and practices.”
The following are observed trends in regards to organizational aspects such as culture, process, and communication.
- Level of change management comfort/ willingness
- Notable challenges throughout all visits regarding level of comfort and willingness to accept change management including job roles, additional responsibilities, and changes to current practices.
- Significant variances in the understanding of what would be required in terms of level of effort among leadership members
- Bulk of resistance experienced from academic/ teaching staff who have prescriptive allocations of their time related to teaching and advising
- Organizational support for analytics
- Staff (inclusive of academic and university/ college individuals) were particularly concerned with the impact on their current job requirements, roles, and workloads
- The overall communication from all staff level roles was that a “top down” directive from leadership members would be necessary to properly implement learning analytics efforts
- Organizational infrastructure
- Most institutions did not have the organizational infrastructure currently present to support the implementation and adoption of learning analytics technology
- Several did not have formalized organizational structures and many did not know what other departmental staff did on a daily basis or how their jobs affected each other
- Most were very concerned about issues of redundancy, additional workload, and time management
- Policy/ Practice management
- Overall, the institutions did have their own policies and practices in place that were currently being managed; however, there were great discrepancies in most institutions regarding how the staff and leadership perceived the management of policies and practices
- Several institutions were concerned about issues of micromanagement, current inconsistencies of policies in place, the execution/ accountability of those policies and practices, and whether learning analytics would add to their already overloaded requirements
- Ease of integration with existing organizational structure
- There were many concerns expressed about how learning analytics would actually work in practice. All institutions liked the theory and the idea behind it, but were uncertain about what it would mean to actually implement it
- Most of the organizational structures in place did not support learning analytics implementation. For example, many institutions were divided about their use of personal tutors (some did not have this role at all) and instructors/ lecturers. Determining who would be responsible for implementation was a topic of much debate
Organizational Trends Summary
Overall, from an organizational perspective, there was a high level of support for learning analytics. While there were concerns, as expressed above, the learning and teaching, academic staff, and student groups all felt strongly that learning analytics would be of benefit to the institutions; however, only if it were implemented correctly and with the full participation of all required groups. High-level buy-in did vary from institution to institution, but there were more supportive members of leadership than not. Very few institutions had organizational challenges and obstacles that could not be overcome with communication, training, and involvement from several departments throughout the institutions.
 Trends: Technical
The following are observed trends in regards to technical aspects such as data, infrastructure, and integration.
- Demonstrates sufficient learning analytics knowledge
- Most technical departments throughout the institutions had some knowledge of learning and predictive analytics; however, much of their knowledge and experience was in academic analytics
- The bulk of the time spent on education about learning analytics was experienced within the technical departments themselves
- Institutional infrastructure
- Many of the institutions already had a data warehouse, but housed only limited integrated data from only one or two systems. For example, the VLE (Virtual Learning Environment) and the SIS
- All of the institutions still had many “manual processes” (e.g., collecting attendance manually on Excel spreadsheets) that were not being captured or housed in a collective place
- All of the institutions expressed interest and a desire to have collective information in one place that was easily accessible (i.e., a “one source of truth” concept)
- Data management
- All institutions were using data but for many different purposes and none of them were in sync. Most were not aware of which data other departments were using and for what purpose
- They were all compliant with Data Protection laws and policies; however, each department appeared to have their own interpretation of those laws and policies
- They expressed a desire to have a unified way of managing data across the entire institution
- Ease of integration with existing infrastructure
- Due to having so many different systems and data sets, the ease of integration appeared to be a challenge for most institutions. Institutions were using an average of 8-10 different systems and many more different ways of collecting and interpreting data
- Many also had previously purchased commercial systems that may result in some challenges with integration of learning analytics technology
- The integration of systems depends highly on the expertise of both the institutions’ technical teams and their ability to comply with the xAPI and UDD (Universal Data Definitions) requirements. Due to the many inconsistencies with data collection, much work will be needed in this area for the institutions
- Maintenance
- This was a major concern for all technical teams throughout the institutions. None of the institutions had a high variety of skill sets among their staff to be able to manage the learning analytics implementation in-house, nor would they have the same level of expertise to maintain the technology. Data Scientists, Data Engineers, Business Analysts, Quality Assurance, and other technical roles were not found at any of the institutions
- Institutions would be in need of constant support during and after the implementation of the technology
- Resource support
- While there was buy-in for the implementation of learning analytics, all institutions had smaller technical teams with concerns related to resource allocations, workload additions, and time management
- Most also expressed the desire for explicit prioritization of learning analytics from leadership to help them guide and direct current resources and work efforts
Technical Trends Summary
Technical trends centered around the availability, access, and use of data, as well as the staffing needs to deploy and maintain a learning analytics environment. However, very few institutions had technical challenges and obstacles that could not be overcome with communication, training, and involvement across departments throughout the institution.
Conclusion
In the aggregate, our measurement of “readiness” across the institutions we served yielded an average of a “somewhat ready” to “ready” score. This denotes the majority of the institutions visited were reasonably ready to implement some element of learning analytics technology solutions, provided they address the more glaring challenges first. As these institutions move forward, it will be key for them to keep open communication with all of the Readiness Assessment participants throughout the project; without this, there will be a significant decrease in buy-in, enthusiasm, and willingness to accept/ adopt change.
The following selection of quotes come from a few of the institutions we visited and demonstrate the value of the Readiness Assessment approach:
“Just getting the groups together to talk to each other has been a valuable experience. Most have never even met and the discoveries made about how different departments affect each other has been brilliant.”
“We are extremely grateful for the guidance and assistance in aligning the university and encouraging genuine conversation on how we take learning analytics forward.”
“As a senior member of staff, it was valuable to look at this process from both a top-down and bottom-up approach to determine the best way to provide support and leadership around the [learning analytics] initiative.”
Based on client feedback, Unicon now offers a service to help institutions get started with learning analytics that includes similar readiness activities. LA Quick Start provides institutions with an environment to help get them off the ground, which can evolve into a full learning analytics solution at each institution’s own pace. The service includes data integration with the LMS into a Learning Record Warehouse (on-premise or in the client’s cloud environment), and the ability to view student activity through dashboard visualizations. In addition, Unicon includes consulting hours with this service to help with an analytics Readiness Assessment and/or roadmap planning.
LA Quick Start can be used to get conversations started across various groups on campus, which is one of the key factors in getting onto the path towards success with learning analytics. View the LA Quick Start datasheet for more information.
Useful Reading
Jisc, Effective Learning Analytics, 5th UK Learning Analytics Network Event (2016)
Jisc, Learning Analytics Discovery Service (2015)
2 replies on “Learning Analytics Adoption and Implementation Trends”
Hello, I read that the “Bulk of resistance experienced from academic/ teaching staff who have prescriptive allocations of their time related to teaching and advising.”
I don’t suppose this is a surprise, the types of question academics might reasonably ask are:
– what do I stop doing that I currently do in order to find the time to use the analytics information?
– what is the purpose of the analytics information – what do you want me to do with it?
– how is my life being made easier / more rewarding by this technological innovation?
Unless these and similar questions can be convincingly answered, then resistance to change would seem to be natural.
Back to the readiness test, were the organisations in a position to create an environment in which academics work that was supportive of the changes being asked of them?
Thanks, Stephen.
Hi Stephen,
Thank you for your question and your reply. I do understand the concerns coming from Academics and do not dismiss them either. There are many larger-scale cultural and organisational aspects that will need to be directly addressed related to a larger adoption of learning analytics. It is not only a technical solution and cannot be treated as such. The suggestion has been made to most institutions to begin with a smaller pilot to help identify issues (both technical and organisational/cultural) and brainstorm potential mitigation strategies before a larger roll out. In some institutions, we have seen that Personal Tutors that are selected to be part of the pilot have their workloads altered to accommodate the new technology testing and organisational changes needed. All institutions have been interested in receiving feedback and having involvement from Academics to ensure everyone is working together to find the best route for learning analytics integration into their campuses.
I hope this provides some additional information for you regarding your inquiry. I will also state that there will be other articles published in the coming months that do provide direct institutional feedback regarding how to address some of the challenges outlined in this particular article. I’d encourage you to be on the lookout for those as well.
Thank you,
Lindsay Pineda