In previous posts I’ve looked at the emerging tools for monitoring user engagement, and adding more sophisticated engagement metrics. I’ve also examined the learning analytics systems being offered by vendors of virtual learning environments (learning management systems) and student information systems. VLEs and SISs are the places where most data about students and their learning are held, so it can make sense to deploy a system built on top of one of the key systems already in use in your institution.
But many universities and colleges are using generic business intelligence (BI) systems to obtain insight on various aspects of their operations – and are beginning to use them for analysing the student learning experience too. I’m going to look at three of the most widely used systems here: IBM Cognos, QlikView and Tableau.
Cognos is a well-developed BI system in use by many educational institutions to help analyse all aspects of their business including finance, enrolments, human resources and student success. The product is marketed as a comprehensive BI tool rather than being aimed primarily at retention or student success. With the incorporation of SPSS Modeler and the SPSS statistical engine within Cognos users can perform predictive analytics alongside their other BI functions.
Qlikview is marketed as an easy to use BI system (and is reported to be so by some of the institutional users I’ve met, as well as being relatively inexpensive) and already has significant adoption in education. Some institutions have been jointly building a number of educational apps with the company which are available to users of the system.
Tableau is another generic BI and visualisation tool which is being used for analysing many aspects of business, including learning, at educational institutions Worldwide.
What do the products do?
Cognos is a generic solution for all aspects of business intelligence and analytics. Its core functionality is described as enabling users to answer key business questions and to:
- Easily view, assemble and personalise information
- Explore all types of information from all angles to assess the current business situation
- Analyse facts and anticipate tactical and strategic implications by simply shifting from viewing to more advanced, predictive or what-if analysis
- Collaborate to establish decision networks to share insights and drive towards a collective intelligence
- Provide transparency and accountability to drive alignment and consensus
- Communicate and coordinate tasks to engage the right people at the right time
- Access information and take action anywhere, taking advantage of mobile devices and real-time analytics
- Integrate and link analytics in everyday work to business workflow and process
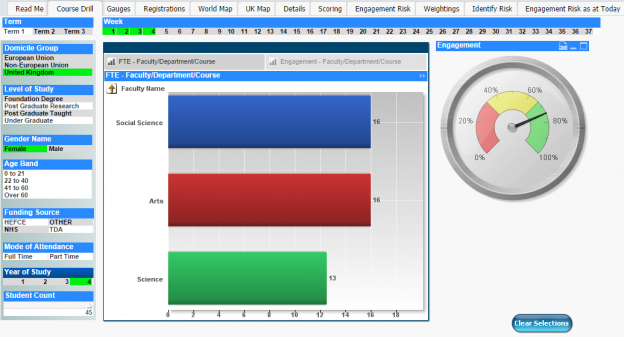
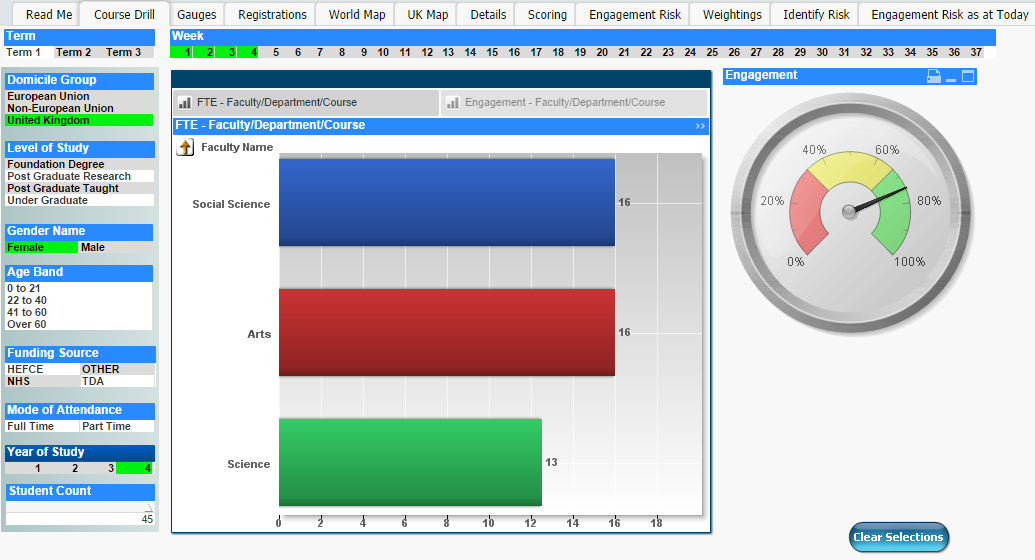
This list could be used to describe much of the functionality present in the other products. QlikView allows users to integrate data from a variety of sources and develop dashboards and visualisations of areas such as student performance and retention, easily breaking these down by areas such as age, gender, course and faculty. It does not however deal with workflow and process. The largest UK reseller of QlikView, BME Solutions, has developed a range of education-specific applications for the system which make it relatively easy for an institution to monitor engagement and other metrics.
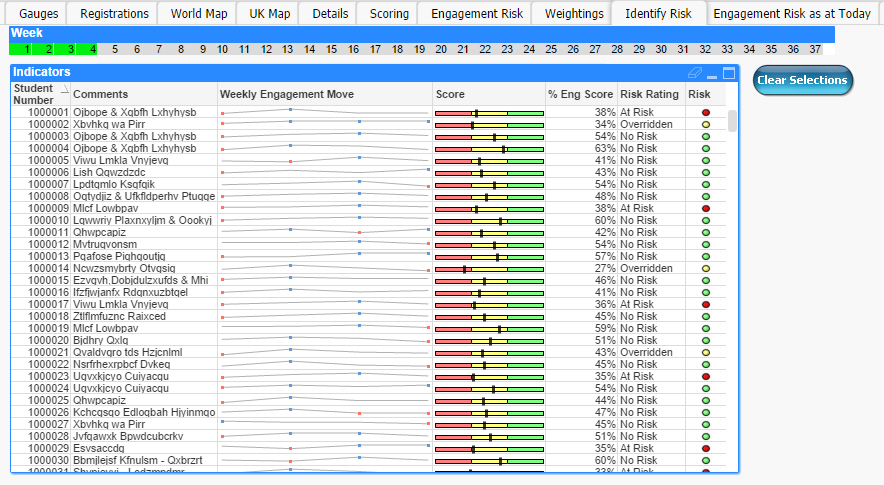
Because of the generic nature of all three of these systems any required metrics can be generated from the underlying data. QlikView provides “models” with a number of educational metrics such as NSS scores and an “at risk” indicator.
No customised learning analytics applications appear to be offered with Tableau. A range of visualisations can be created using a drag and drop interface once the data has been linked to the system. At the University of Kansas academic advisors are given a dashboard built on Tableau of individual students, synthesizing information from various databases. The tool has been customised to enable communication with students who fall into particular categories such as those who are not performing well or who have not had an advising appointment.
Interventions such as emails to groups of users or students at risk can also be triggered based on analytics in all three products.
Who are the systems aimed at?
Because of the generic nature of all three systems, dashboards, scorecards and reports can be generated for any type of user across the organisation.
How extensively are they being used?
Already in use by many universities and colleges for a number of years (Sheffield Hallam was using it as far back as 2006, for example), Cognos is increasingly being seen as a solution for learning analytics. IBM is working closely with various universities in the UK to customise Cognos for their needs, notably London South Bank University.
36 universities in the UK use QlikView and there is a BME Solutions QlikView UK user group which meets every six months for institutions to share experience. BME also has a small number of customers in UK further education.
Though it has a smaller market share in the UK than Cognos and QlikView, many institutions worldwide are using Tableau, including various Ivy League universities. It is not clear to what extent they are using the product for learning analytics rather than other functions such as enrolment and fund-raising. However I do know of at least one UK university which has been trialling it for learning analytics visualisations.
Technical architecture
Cognos is built on a service-oriented architecture and runs alongside a data warehouse which is populated from key systems. A database is packaged with Tableau and sits alongside it. Data can be visualised from the local database or directly from other sources which can include Oracle databases and Excel spreadsheets. With QlikView, data is stored “in memory” rather than in a data warehouse, and the dashboards store the front end plus the entire dataset they are working with.
Final thoughts
Most UK universities have at least one generic BI tool in use for monitoring and planning of their business activities. According to the UCISA CIS survey SAP Business Objects is used by 22% of institutions, Microsoft Performance Point by 19% and Oracle’s BI systems by 14%. Considering that Cognos, QlikView and Tableau have a lower market share than these others it’s interesting that they are gaining such prominence in the learning analytics field. Meanwhile I’m not hearing of the SAP, Microsoft and Oracle products being extensively used as yet for learning analytics, despite their penetration of the BI market in higher education.
BI systems do already however provide the underlying capability for some of the learning analytics solutions available. Blackboard Analytics for Learn uses Microsoft Performance Point to build its dashboards. Cognos sits under Desire2Learn’s Insights learning analytics product and Ellucian Banner Student Retention Performance .
Tools such as QlikView and Tableau are reportedly easy to use and relatively cheap to deploy. The fact that they sit outside the VLE and the SIS has both pros and cons. Unlike the new learning analytics products emerging from VLE and SIS vendors, BI systems are so generic that they may require considerable customisation both to the institutional context and for carrying out learning analytics specifically. The educational applications and the active communities around some products (notably QlikView) may make that contextualisation much easier. Meanwhile the fact that they are not tied closely into another product has the benefit of reducing vendor lock-in.
One reply on “Learning analytics using business intelligence systems”
[…] Learning analytics using business intelligence systems by Niall Sclater A review of several generic Business Intelligence solutions (including Cognos, Qlikview, and Tableau) which are typically employed for the sake of gaining operational insight, and ways in which they might be leveraged to gain insight into student learning experience as well. […]