This week, Research England launch the Knowledge Exchange Framework (KEF) website which showcases interactive dashboards co-developed by Jisc data analytics. The dashboards draw together tangible evidence on knowledge exchange activities between English higher education institutions and their partners – from big businesses to the local community – as well as providing indications of institutional performance relative to their peers. In this blog, we look at some of the data available and how you can get the most from it.
Introducing the knowledge exchange framework
Higher Education Institutions (HEIs), such as universities, teach students and undertake research that creates new and useful knowledge. They also work with many different types of partners to ensure that this knowledge can be used for the benefit of the economy and society – this is known as knowledge exchange (KE).
These partners range from individual members of the public who may attend events organised by a university, to a multinational company partnering with a university to develop new medicines. The activities may include (but are not limited to) public events, providing access to specialist equipment or facilities to businesses, undertaking consultancy, or licensing intellectual property so others can use it. Universities also play important roles in their local area, particularly when it comes to economic and social regeneration projects.
The Knowledge Exchange Framework draws upon a number of these activities and provides a graphical representation for each university to show how they are performing relative to similar institutions. The KEF is a low-burden exercise, where it mostly derives its data from an annual statutory data return – the HE-BCI survey.
The new kef.ac.uk data platform
The first iteration of KEF provides a user-friendly interface for institutions, businesses and the wider public. It allows them to access and explore the relative knowledge exchange strengths of institutions, as well as offering some important insights as to how the work they take forward supports the levelling up of society. Prof Ottoline Leyser, CEO of UK Research and Innovation explains this in more detail below.
“UKRI values the diverse and varied contributions that our higher education institutions make to society. The Knowledge Exchange Framework, published today by Research England, reflects and celebrates this diversity.
The KEF also brings together rich accounts of how our universities engage in their local areas, contributing in varied and often innovative ways to their local communities and economies. As well as researchers and innovators, the activities captured in the framework highlight the diversity of essential roles – from technicians and project managers, to technology transfer professionals – in connecting discovery to prosperity and public good.”
Prof Ottoline Leyser; CEO, UK Research and Innovation
Jisc data analytics have been involved with the design of the KEF dashboards, website development, and organisation of the data having worked with the team at Research England throughout. A detailed history of KEF including how the project has evolved over time is available here.
Enabling fair and responsible comparison
Comparison is always a challenge when designing sector-wide data. As stated on the KEF website, “a strength of the English higher education sector is its diversity” and thus institutions should not be viewed under one broad lens which ignores this. With that in mind, and to present a KEF that provides meaningful insights, it was essential that the design of the framework took account of the diversity of the sector. The KEF therefore only looks to compare institutional performance with other institutions that share similar demographic qualities.
The KEF does this by grouping institutions into ‘clusters’ of peers – institutions with similar characteristics such as how much research they do and in what subject areas. The KEF has always recognised that institutions, even within a cluster, will likely have diverse strengths across particular areas of knowledge exchange, which will ultimately reflect the aims of their institutional strategies and missions. Therefore, this reinforces the key point that institutions are not expected to be above the average score for their cluster group in every area. Moreover, Research England believe it is not appropriate for the KEF results to be fed into a league table or simple ranking of institutions, as this approach would oversimplify the nuanced complexities of capturing knowledge exchange fairly.
New and expansive data on knowledge exchange
The KEF dashboards are split into seven key knowledge exchange themes (referred to as perspectives) for each institution and cluster group. These themes are:
- Public and community engagement
- Research partnerships
- Intellectual property and commercialisation
- Local growth and regeneration
- Working with business
- Working with the public and third sector
- Skills, enterprise and entrepreneurship
KEF overview dashboards:
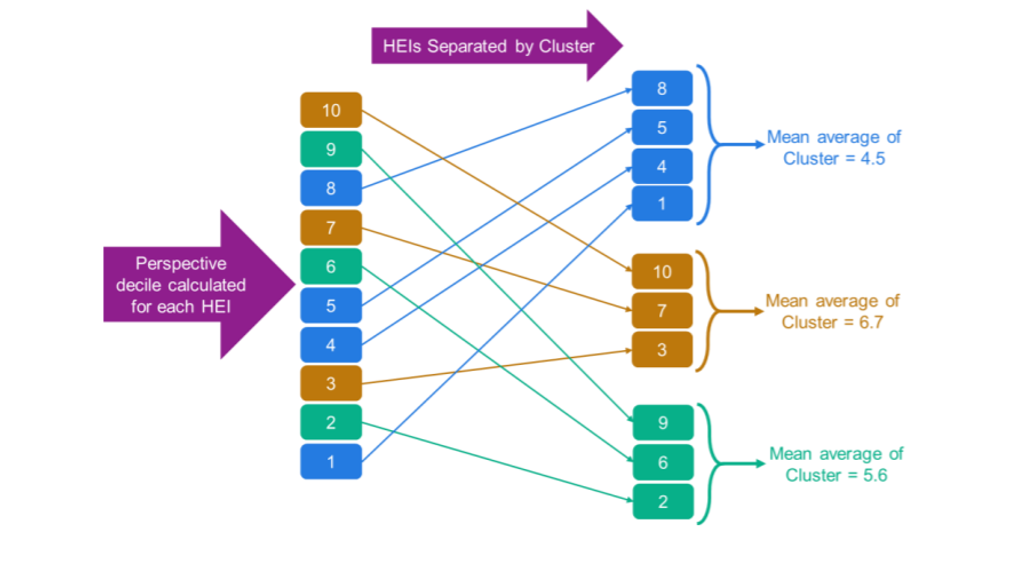
The overview dashboard presents a snapshot of institutional performance for each knowledge exchange theme (represented in deciles). Deciles are calculated for each institution relative to the sector, whereas cluster group averages are then derived for meaningful comparison against a peer group (cluster) with similar characteristics. This methodology is shown visually below.
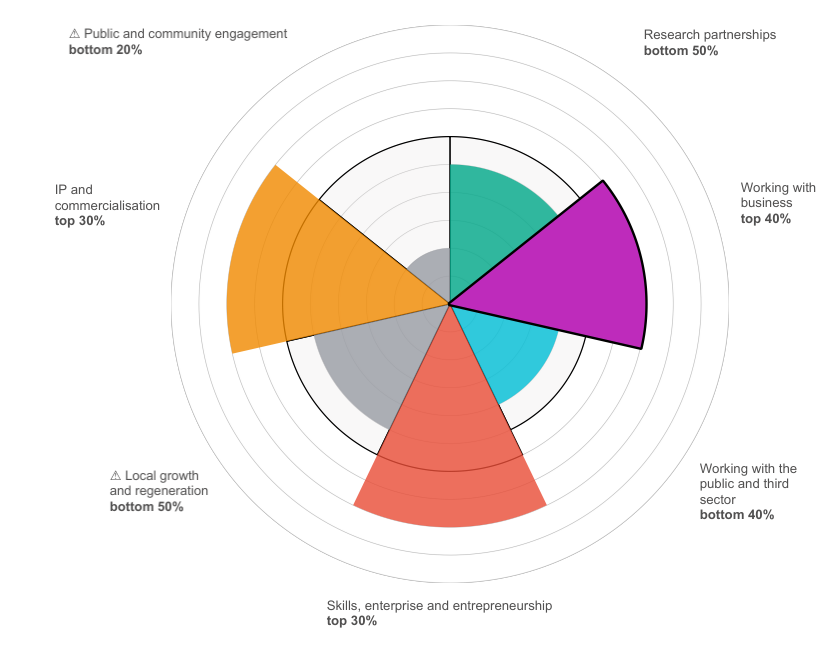
In the example overview dashboard below, you can see that for the ‘Working with business’ perspective, the institution performs in the top 40% of the sector, and alongside its cluster group average (represented by the black lines) which also performs in the top 40%.
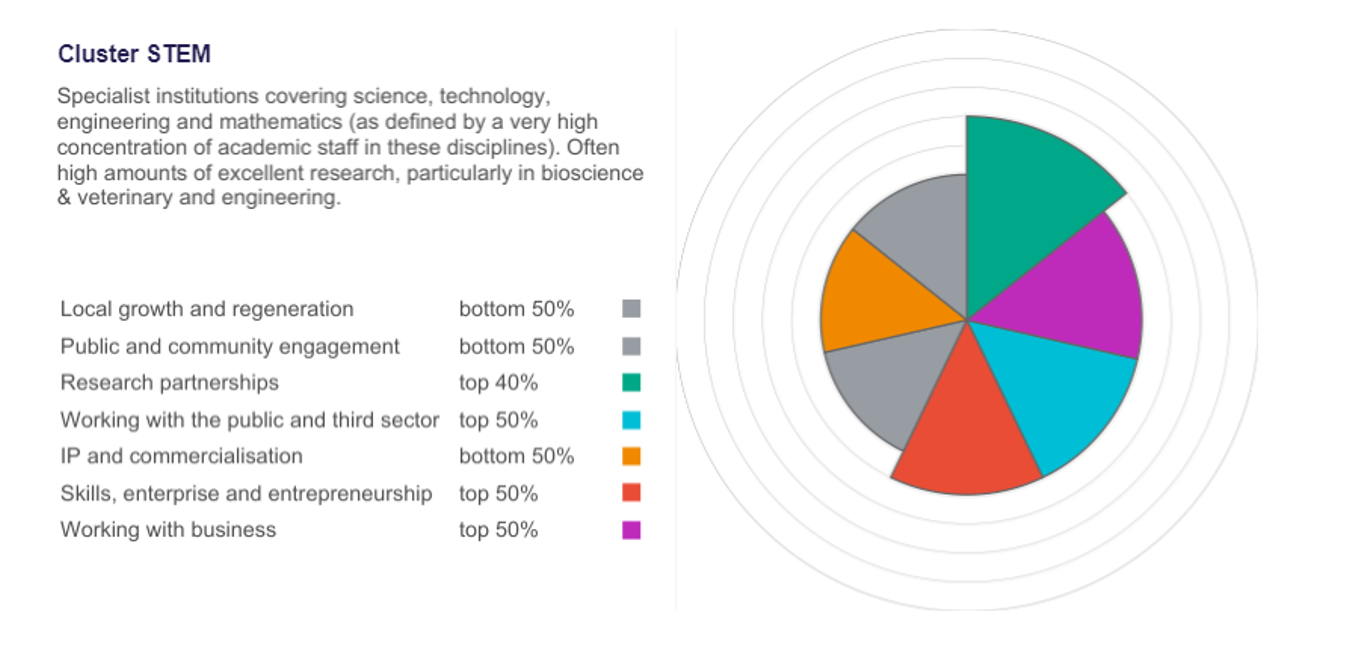
The KEF dashboards also include a ‘cluster view’ such as the STEM example below to assist with fairer and more meaningful comparisons in response to the challenges mentioned earlier.
Additional dashboard functionality includes the ability to find an institution on a searchable map, as well as the ability to make direct comparisons between two selected institutions.
Data within perspectives:
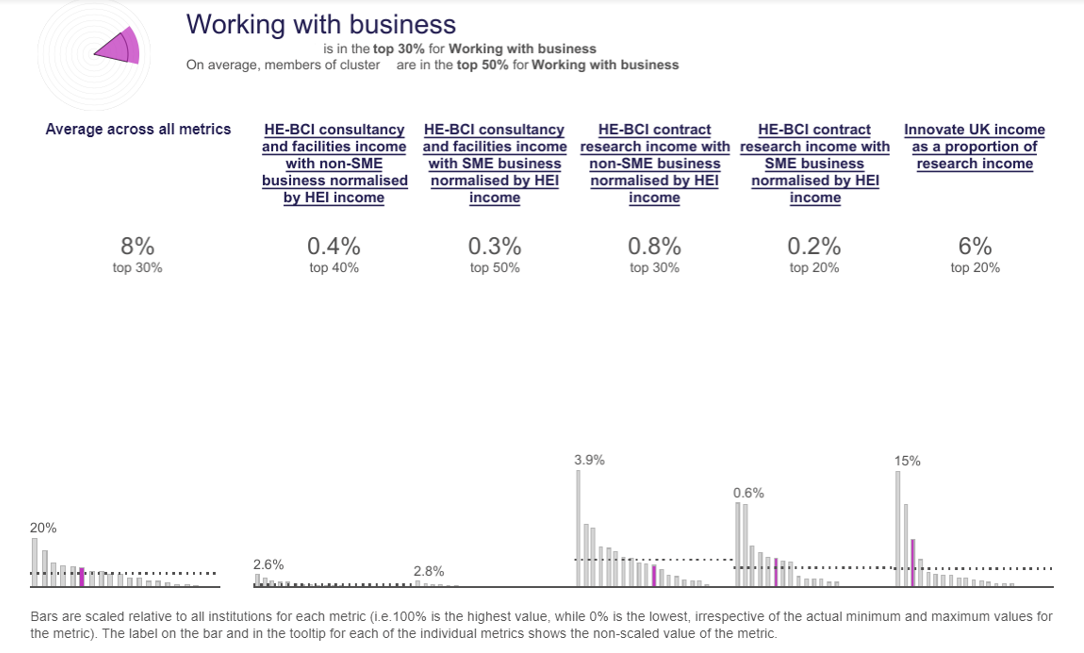
Metrics – These quantitative data sit within five of the seven perspectives and combine to offer the overall perspective decile score. Each metric is based upon a three-year time series of data and can be clicked to explore in further detail including a comparison of other institutions within its cluster.
Institutional narrative statements – For two of the perspectives, ‘Local growth and regeneration’ and ‘Public and community engagement’ (both shaded grey in the overview polar dashboards above), the availability for robust metrics and data sources were limited. Institutions were therefore asked to provide additional narrative statements to showcase their work in these areas. The narrative statements are designed to be factual, evidence-based statements, and are structured to allow comparison between institutions and clusters. The ‘Public and community engagement’ narrative embeds a self-assessment exercise developed in partnership with NCCPE (The National Co-ordinating Centre for Public Engagement). The scores from this exercise are included in the overall decile score for the perspective due to the lack of robust metrics available.
More information on the range of data available (including institutional context statements) and methodology used can be found on the KEF website.
Extracting insight from KEF – Shining a light on the value of enterprise
The KEF dashboards bring together a multitude of data. This includes the narrative statements which contribute rich insights on knowledge exchange activities, such as how institutions support their students to develop enterprise skills and entrepreneurial ability that benefits wider society. Below is one example of how you can extract insight from a singular KEF perspective.
When viewing the ‘Skills, enterprise and entrepreneurship’ perspective at a cluster level, it shows the below cluster performs in the top 50% of the KEF population.
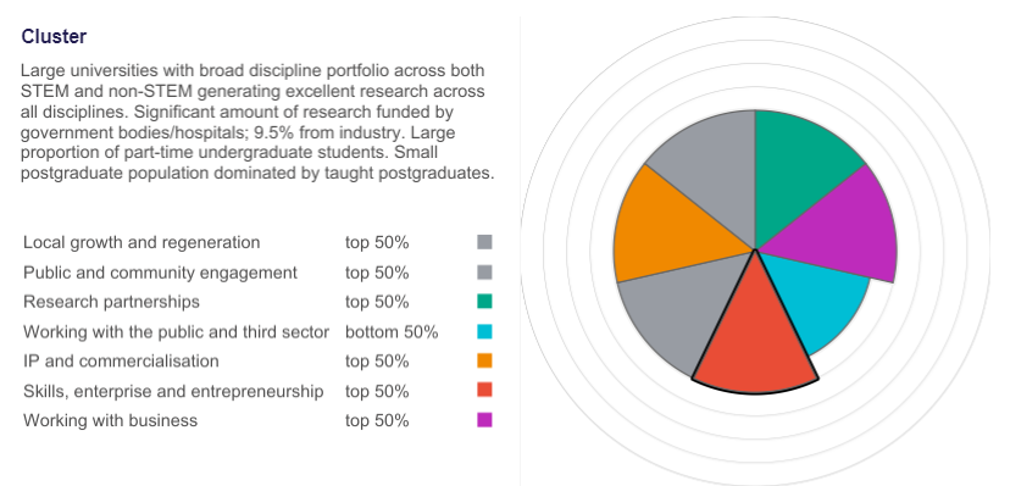
From here, we can explore what activities members of this cluster are engaging in to better understand their cluster polar chart score.
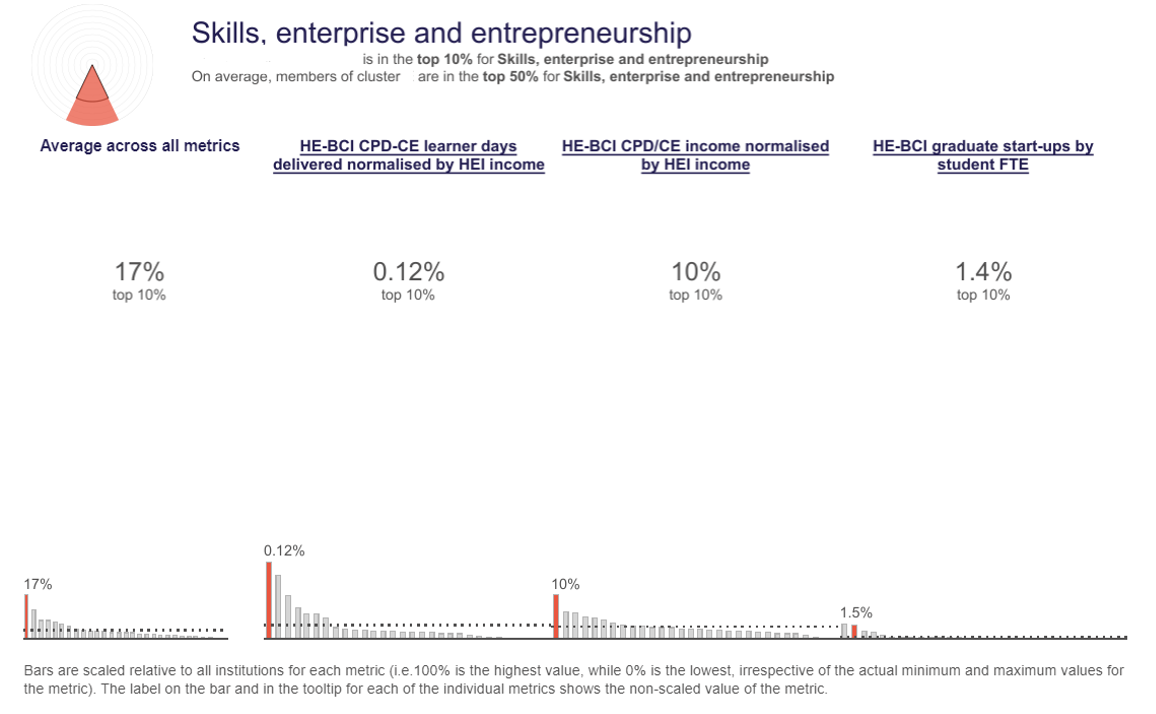
After selecting a member from the cluster and looking at their relevant activity metrics, we can see they are delivering a strong performance in CPD (continuing professional development) and CE (continuing education) related activities, ranking first in its cluster as depicted from the bar charts on the image above. They also perform strongly in the number of start-ups being set up by their students. Each metric can also be analysed over time (by clicking it) which takes you to a ‘metrics level’ view where you can view the underlying data year-on-year over a three-year time period (For example, the number of student start-ups established).
As a final piece of exploration, the institutional narratives were then examined to identify any additional context relating to the theme of enterprise. In this case, there were many references to entrepreneurship and employability which partially explain the success of this knowledge exchange as demonstrated by the excerpt below:
“Our students are supported to engage in entrepreneurial and/or employability activities, embedded throughout each course… Extra-curricular student support for entrepreneurial/intrapreneurial activity is driven by dedicated faculty/professional service staff, student-led societies and funded externally facing enterprise projects.”
Example institutional narrative statement
The narratives also helpfully offer a point of contact for general institutional level knowledge exchange queries, as well as providing a specific nominated contact point for ‘Local growth and regeneration’ and ‘Public and community engagement’ activities. This enables the user to broker a conversation with the institution and provides an opportunity to ask questions or receive additional information regarding activities they coordinate. The inclusion of both quantitative and qualitative data provides complementary insights into institutional level strategies and activities. When viewing the dashboards in their entirety, users are taken to the heart of great knowledge exchange and can unearth stories that are driving success across our communities.
A powerful, sector-focused tool that adds value
The KEF dashboards have been designed for maximum transparency using multiple years of robust, trusted data from reputable sources such as HESA. They offer a significant opportunity for institutions to analyse their performance across various aspects of knowledge exchange, broaden their understanding of where they are doing well and how their performance relates to their strategic aims. David Sweeney, Executive Chair of Research England expands this point below.
“Universities engagement with society through Knowledge Exchange is an essential part of their mission alongside research and teaching. The Knowledge Exchange Framework will help universities understand where their strengths are, relative to others with similar missions. It showcases a diverse picture of the tremendous work they do in their places, nationally and internationally.”
David Sweeney; Executive Chair, Research England
The KEF aims to foster a culture of continuous improvement and therefore benefit the wider sector as community partnerships get stronger and more knowledge is shared effectively.
The future of KEF
This release marks the first iteration in the KEF journey, but Research England identify that there is scope for future development. Your feedback will be vital in shaping future iterations of KEF and the accompanying data collections, so let the team know what you think of the website and wider KEF initiative by emailing them here.
Other ongoing work will include analysis of the institutional narratives to identify further insight from the qualitative data.
Dr Hamish McAlpine, Head of KE Data & Evidence at Research England, who has led on the development of the KEF comments:
“We’ve been delighted to partner with Jisc data analytics on the development of the KEF dashboards. This started with exploring how best to visualise the data via an Analytics Lab exercise, which was a great space to explore and develop our thinking. But Jisc have also been very effective at developing the final dashboards and associated content in an agile and responsive way. Their deep understanding of the HE sector and HESA data made them a natural partner for this project.”
Dr Hamish McAlpine, Head of KE Data & Evidence at Research England
Contact Jisc’s data analytics team to discuss your requirements
We design and develop bespoke data analytics solutions for our members and customers. If your organisation would like to enquire about the design and productisation of higher and further education data analytics dashboards, contact us quoting ‘DA-Dashboard 2021’ in your communications.
We look forward to hearing from you.
T: 0333 015 1165
Jisc data analytics on LinkedIn
Author – Matt Clarke, Content Insight Manager