Using Analytics to Enhance Student Support and Improve Learning
Jisc Learning Analytics Research Projects Update, July 2020.
Introduction:
The use of analytics, data and algorithms to enhance learning is an increasingly trending topic. No more so than here in Jisc. I recently attended a learning analytics (LA) research event to see how seven Jisc-funded research projects were progressing and how they were using analytics to improve education. Below is a snapshot of each project and some of my key takeaways from the session.
Project 1 lead: Dr Dave Perkins and Cameron Gray, Bangor University.
Learning analytics area: Curriculum analytics
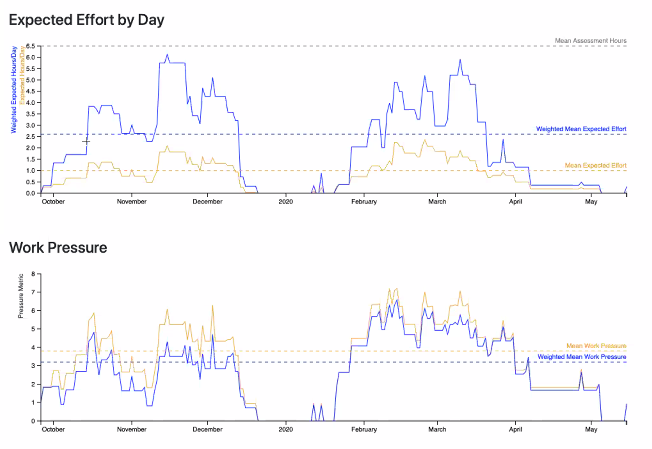
Project summary: This project is looking at different types of student behaviour in response to assignments and the impact it has on their expected effort and work pressure levels. Some students leave their work to the last minute whereas others respond differently. This information is then being used to produce an expected effort and work pressure metric which factors in the number of assignments at any given time and the type of behaviour that student tends to exhibit. These tools can be used to help support students more effectively based on their own circumstances.
Project progress: The metric has been built for one behaviour type with others in the pipeline. There were some clear pressure peaks in the model demonstrated as well as the potential to redistribute assignments to spread them more evenly.
My key takeaway: Understanding when a student is likely to be at their most stressed based upon their behaviour and workload is a fascinating concept. Especially if that allows for support to be tailored for them.
Project 2 lead: Dr Ed de Quincey, University of Keele & Dr Martyn Parker, University of Warwick.
Learning analytics area: Curriculum analytics
Project summary: This project looks at the use of learning analytics to inform and improve curriculum reviews by reducing bias and subjectivity. This combines existing data such as module results and student feedback with analytics such as attendance, VLE & library usage as well as historical data. The project has worked directly with stakeholders across the university to evaluate the existing process and look at ambitions for the new system.
Project progress: A tool has been created based upon the discussions with stakeholders. This includes data visualisations on grade distribution and module performance comparisons as well as a range of VLE usage metrics for the first time which were combined with student feedback. The feedback from stakeholders has been favourable and has formed new user-centred guidelines around curriculum review.
My key takeaway: Improving the way that the curriculum is reviewed has a huge compound effect on learning in the long-term. This compounding effect doesn’t just impact students, but anyone involved in the learning process.
Project 3 lead: Dr Carmen Tomas, University of Nottingham & Simon Walker, University College London.
Learning analytics area: Curriculum analytics
Project summary: This project looks at the role of analytics for assessment and feedback in institutions. It recognises that learning analytics is still in its infancy and that actionable insights are needed to support better decisions. It looks to use analytics to improve staff and student decision making but also recognise some of the difficulties involved such as missing data and barriers to implementation.
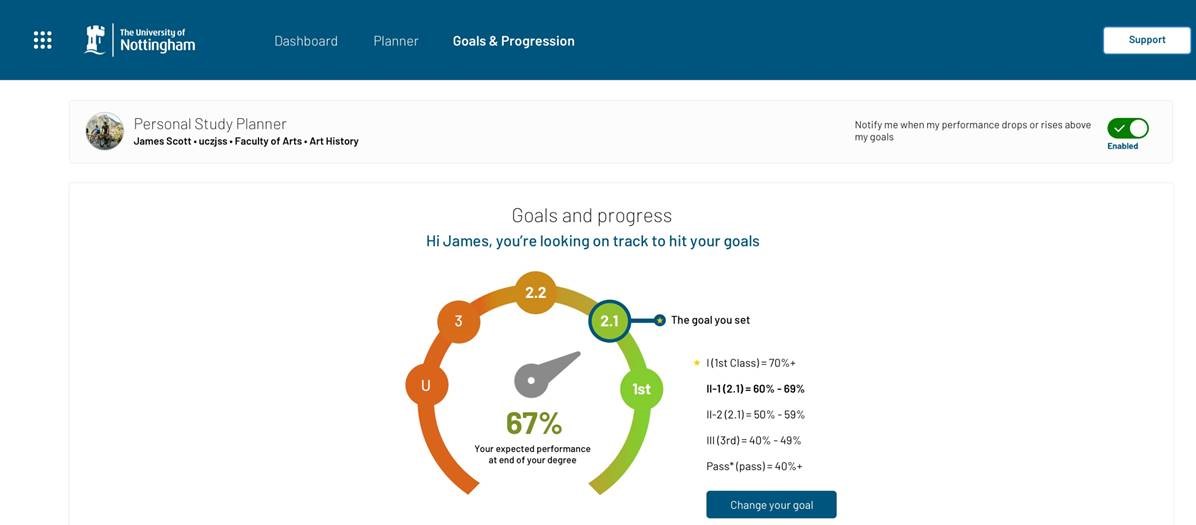
Project progress: Some analytics mock-ups have been produced looking at metrics that contribute to student time management, monitoring and goals, as well as staff decisions on design and review of assessments. Nine analytics proposals were created with 20 data elements (14 from staff and 6 from students) which were presented in a consultation to stakeholders. The verdict from it was positive and stakeholders believed they would be able to make better decisions if this information was available.
My key takeaway: Define your constructs (ideal solution or big idea) first and then worry about the data you need. Throwing data at something doesn’t guarantee success. It was interesting to see that this was the second project concerned with student workload with favourable feedback on using analytics.
Project 4 lead: Dr Tim Coughlan, Kate Lister, The Open University.
Learning analytics area: Mental health and wellbeing
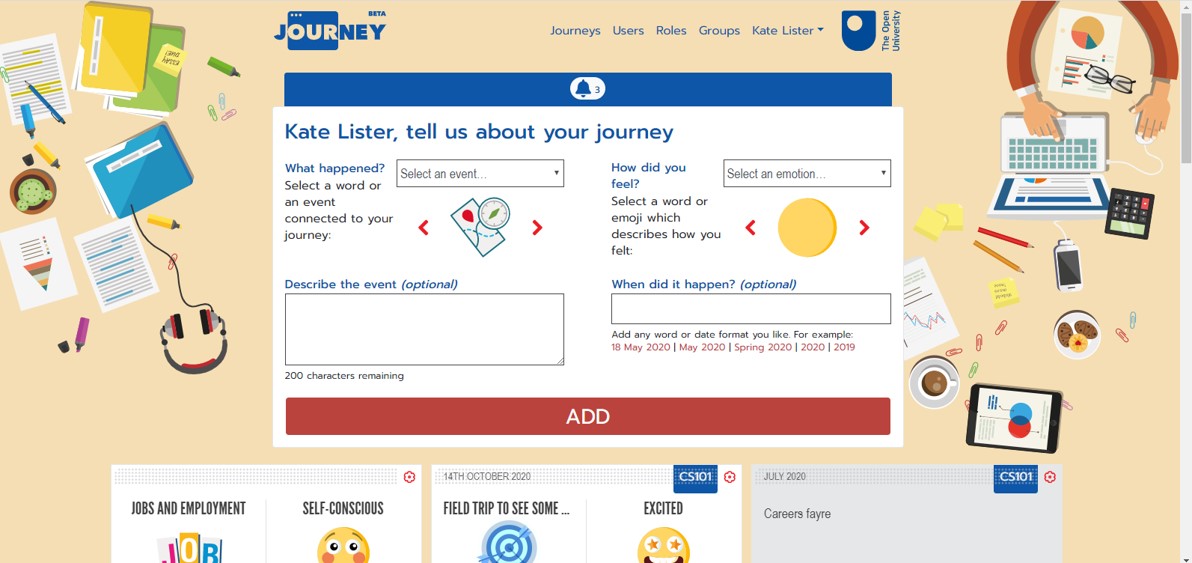
Project summary: This project looks at student emotional awareness and mapping their university experiences which can often be hidden or go unnoticed. This involves logging their study journey and using emojis to note how they were feeling along the way. This data can then be used to understand student mental health, help build resilience and put better support in place.
Project progress: This project was initially in a game like form where students logged the experiences that they wanted to. It has now expanded to look at linked journeys and creating a tool which can support students on their wellbeing as well as widening the range of available emotions and data. This includes some common milestones which provide institutional insight as well as building a narrative over time. The results of a trial using the tool was that among other things, it helped students reflect on their challenges and achievements more. Further modifications to the tool have been made such as the ability to group journeys giving better data as well as considerations on how journeys are shared.
My key takeaway: Emotional awareness, resilience and wellbeing were already trending topics before Covid-19. Work like this starts to offer practical solutions where we can learn more about the student journey and how we might better support them. That seems to be especially important in the current context.
Project 5 lead: Martin Lynch, University of South Wales
Learning analytics area: Evaluation of institutional learning analytics projects
Project summary: This project is evaluating the impact of implementing Jisc’s Learning Analytics service at the University of South Wales over a three-year period. It is one of three institutional evaluations presented in this session. At South Wales, the service aims to use analytics to positively impact personal academic coaches, module and course leaders as well as students.
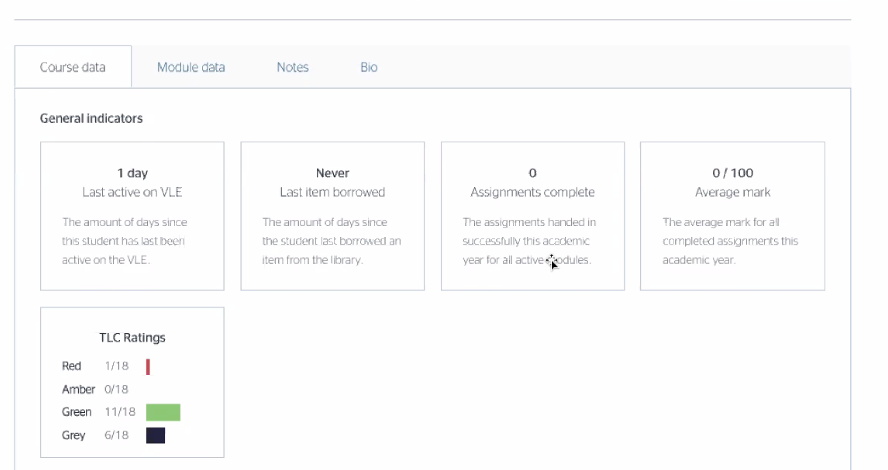
Project progress: The service went fully live in September 2018 and the analytics available include dashboards on learner success and engagement. These dashboards use VLE (virtual learning environment), library usage, assessments and attendance monitoring data. The dashboards allow better support interventions to help students at risk of withdrawing early (indicated through a range of red / amber / green traffic light alert systems). Students also have a study goal app to check in to lectures (their main use of it at South Wales) and log their progress as they learn. Module leaders also have a wealth of usage data to explore. An impact study of the implementation found that amongst other things, it provided better support for personal academic coaches in many cases and improved attendance monitoring. It also recognised some of the challenges along the way such as the capacity needed to move the project to business as usual.
My key takeaway: I have always liked the visual cues that the traffic light alert systems provide. That high level snapshot which then drill down into the other areas can tell you a lot of information very quickly. Such insight is clearly very helpful for those tasked with looking after students.
Project 6 lead: Dr Christine Couper, Karl Molden, University of Greenwich
Learning analytics area: Evaluation of institutional learning analytics projects
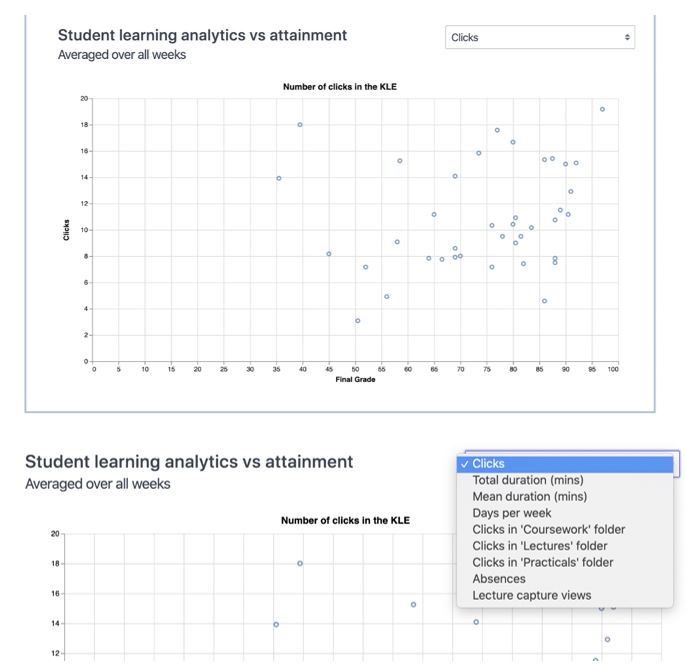
Project summary: Like project 5, this project is evaluating the impact of implementing Jisc’s Learning Analytics service at the University of Greenwich. At Greenwich, they are at the end of year one in their journey. Some key aims of the implantation were to use the service to improve student engagement, increase retention and maximise success by motivating students. This would be done by monitoring attendance and VLE usage, using the insight to intervene where required and allowing students to set goals.
Project progress: This presentation focussed on the statistical analysis of the data available so far as the outcome of staff focus groups and surveys were presented last year. Some of the key conclusions were that VLE usage and attendance did correlate with students’ grade in many cases and that attendance tended to have a stronger relationship with grades than VLE data. They did note that both were useful from quite early in the first term. The next step in this project is to identify potential interventions and monitoring outcomes from this analysis.
My key takeaway: I like this data driven angle to insight. Logically, it makes sense that if someone turns up regularly and engages with the course materials that they are likely to do better than if they didn’t. That’s only anecdotal though and this analysis starts to use the data available from Jisc’s Learning Analytics service to evidence that.

Project 7 lead: Dr Alex Masardo, James Derounian and James Hodgkin, University of Gloucestershire
Learning analytics area: Evaluation of institutional learning analytics projects
Project summary: Like the previous two, this project is evaluating the impact of implementing Jisc’s Learning Analytics service at the University of Gloucestershire. At Gloucestershire, they want to see how learning analytics can aid staff teaching and student learning. They presented the findings from various stakeholder engagement sessions such as staff focus groups and personal tutor feedback as well as student learning data from Moodle & Jisc’s new Checkin+ attendance monitoring solution.
Project progress: Students generally didn’t know what learning analytics were but appreciated the value of some of the data once they understood it better. Staff believed the Learning Analytics service allowed them to apply earlier appropriate support interventions although stressed the requirement for human input when analysing the data. There was a desire to have access to historic engagement data so that appropriate context could be drawn. The learning data showed that staff and students are engaging with the Learning Analytics service, but more is needed before it becomes business as usual. The next step for this project is to work with Jisc on curriculum analytics to assess whether student engagement correlates with outcomes.
My key takeaway: A key conversation was on how students perceive learning analytics. If they see it as a telling off rather than a support mechanism, they are likely to disengage and pull away from it. There is a real requirement for buy in across an institution in order to get that messaging right.

Concluding summary:
This was a session full of insight and thought-provoking work from colleagues across the sector. What was abundantly clear was that learning analytics has the potential to revolutionise the wellbeing of students as well as the curriculums in which they learn. We are however only at the start of that journey and we have much to do before it becomes business as usual across education.
We must recognise that while data is powerful and vastly expands the available evidence base, it can only ever tell us part of the narrative and skilled human intervention is still required to put the right responses to it in place.
Student workload and support were topics that emerged multiple times and there seemed a consensus across the projects that attendance monitoring is an important developing area of learning analytics. A significant moment for me was the analysis presented confirming a positive correlation between attendance / VLE engagement (data generated from Jisc’s Learning Analytics service) and student grades. This has long been suspected by many people, but to see some statistical evidence is fascinating.
In my view, the continued success of these and future projects will come down to two key elements. Firstly, getting consistent buy in from staff across institutions and secondly, ensuring students understand that these analytics are being used to support them rather than punish them.
Author: Matt Clarke, Content Insight Manager, Jisc (matt.clarke@jisc.ac.uk).
More information about Jisc’s Learning Analytics service detailed in projects 5, 6 and 7: https://www.jisc.ac.uk/learning-analytics