An enthusiastic group of 25 people participated in a workshop to explore using data and analytics as part of programme and module review and enhancement.
As part of a curriculum analytics pilot we have worked with five universities to develop some visualisations using existing data from learning analytics to provide insights into course and module design and learning activities. An overview of the curriculum analytics project was presented at the learning analytics network meeting in October. An overview of curriculum analytics and a live demonstration were also provided at the workshop.
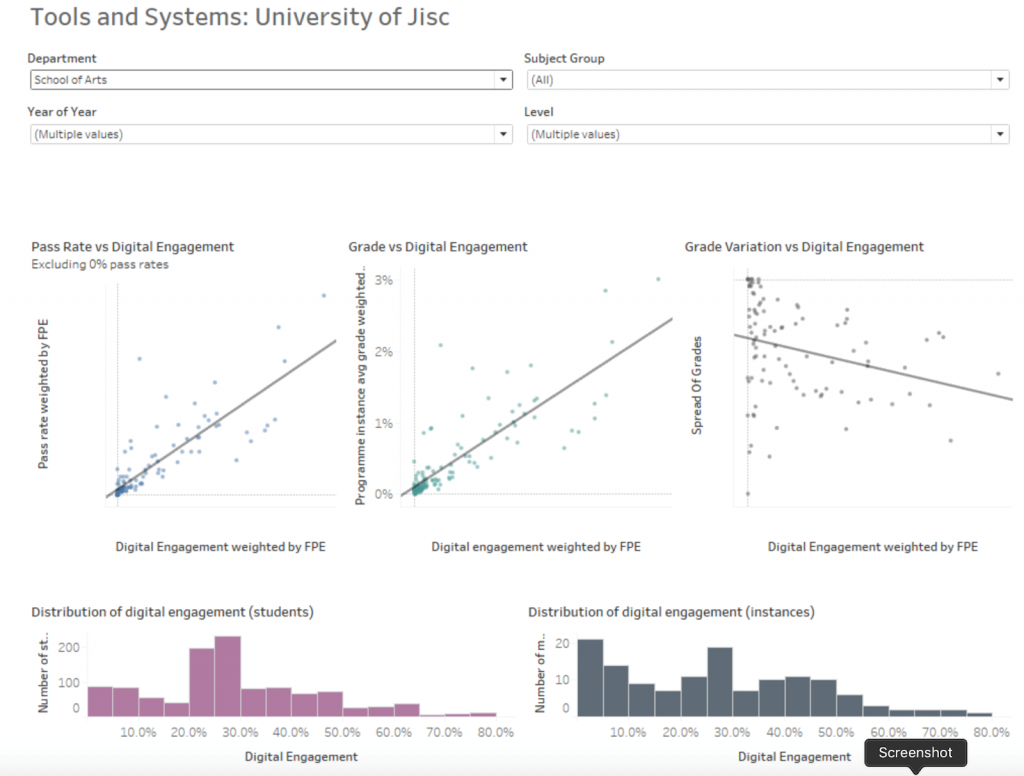
In the workshop participants explored four scenarios with sets of visualisations created as part the pilot project. All data was fake or de-identified and the visualisations are alpha products and the focus has been on the usefulness of the data and metrics. The user design will be part of the next phase of development. Details of the scenarios and visualisations are available.

The four scenarios were
Scenario 1: Strategic Overview as a senior manager. A high-level view across an institution and explore impact across School of Arts
Scenario 2: Course Review as a leader. The review a computing course and associated modules
Scenario 3: New metrics for course review. Some usefulness new metrics that describe courses and modules
Scenario 4: Assessment data as a senior manager. A review assessment strategies and practice across an institution
The participants were asked to consider the usefulness of the metrics and measures in helping to answer the sort of questions raised in the scenario, what other measures would be useful and what was missing?
As was expected looking at the visualisations led to further questions and request for more information and additional data to be included.
All the feedback and outputs have been summarised in a slide deck.
The final activity was to create a new user journey and created a visualisation of what they might expect to be able to view.
- Group 1 asked what tools and learning design work. Can modules be categorised by the pedagogical approach they are using or the style of learning. They asked if there was additional information, we could get from academics or if this could be derived from existing activity data.
- Group 2 wanted a dashboard to inform learning technologists who work with different departments to provide contextual information on courses/modules and issues reports on area for improvement so they could provide more targeted advice and support.
- Group 3 looked at access and participation plan monitoring. They wanted an overview of an entire courses to see the delivery plan for access and participation. View a summary of attainment gaps across courses so they could monitor which plans where working.
- Group 4 wanted to be able to review course metrics over time. So they can see the trend over time for assessment marks, attendance, digital engagement etc. This would allow them identify anomalies and undertake interventions. They also wanted to be able to record what changes have been made to a course or module so it can be monitored in the future.
The outputs from the workshop will be used to inform the next phase of development of a product around curriculum analytics.
