In my last post I described four types of learning analytics products. Here I’ll go into more detail around some of the VLE-based engagement reporting tools. These products for Blackboard and Moodle sit within the virtual learning environment (VLE/LMS), look at its data only, and provide simple indications of a student’s progress, raising flags when the student looks to be at risk. Unlike many learning analytics tools these are aimed at teachers rather than the students themselves or managers within the institution.
Blackboard Retention Centre
Bundled with Blackboard Learn is Retention Centre which provides a simple dashboard view of learner participation within a single course. The functionality evolved from earlier features in Learn such as an “early warning system”.
Retention Center is primarily aimed at identifying students at risk of failure, based on rules set by teachers. The key dashboard provides an overview of a single cohort on a course, enabling you to identify students at risk of failure. You can decide who you want to flag as at risk, add notes on individual learners, and contact them directly from the Retention Centre. It’s also possible from here to change due dates for assignments. There are four basic measurements of student engagement:
- Course activity is a measure of the time a student first clicks on something in the course until he or she clicks outside the course or logs out.
- Thresholds can be set for particular grades, flagging students who have fallen below that value – or those who have fallen a certain percentage below the class average.
- A flag for course access is set when users fail to access the system within a defined number of days.
- The final metric is missed deadline which can be triggered when a deadline is not met within a set number of days or when a specified number of deadlines have been missed.
There are default rules for each of these (which can be customised):
- Course activity in the last week is 20% below average
- Grade is 25% below class average
- Last course access was more than 5 days ago
- There has been 1 missed deadline
Another screen allows instructors to view a summary of their own participation in a course and to link directly to activities that are required of them such as grading. Blackboard suggests that instructors use this functionality to prioritise areas of their courses which need attention. This is a kind of basic “teaching analytics” where instructors can see an overview of their activity and link easily to tasks such as marking or blogging.
The data on what actions you’ve taken through the Retention Centre as a teacher is available only to you. While this may give you confidence that no-one is snooping on your teaching activities, it limits the options for institutions which want to understand better how learning and teaching are taking place. Another limitation is that as Retention Centre works only at the level of a course you can’t get a view of programme or student-level activity.
Moodle options
Other than deploying a generic business intelligence system such as QlikView, Cognos or Tableau, Moodle-specific options include a few plugins for the system, in particular Engagement Analytics and Moodle Google Analytics, and a commercial option, Intelliboard.
As an open source system Moodle allows users to develop their own plugins, and a number of institutions have built analytics tools using the data from user log files. Currently these appear to be considerably less developed than the analytics capabilities of other virtual learning environments, notably Desire2Learn Brightspace and Blackboard Learn. The last release of Moodle Google Analytics was August 2013, though Engagement Analytics, initially released in August 2012, is still being maintained. As with Blackboard Retention Centre, the tools are primarily aimed at staff – not students as yet.
Documentation is limited for all these options. Intelliboard’s product is clearly at an early stage of development, with an offer on its website that any paying customer can request additional reports for free. Moodle Google Analytics takes the data available from Google Analytics and the web server logs and presents it in Moodle and is thus more of a web analytics than a learning analytics tool, though analysing how learners navigate through a course website may be of interest.
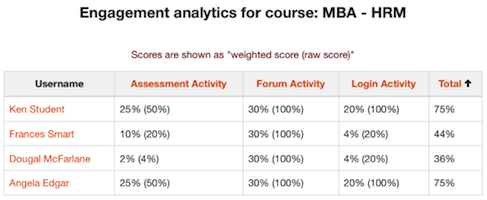
Engagement Analytics presents risk percentages for students based on three indicators:
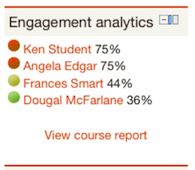
- Login activity: how often and how recently are students logging in, and for how long?
- Forum activity: are students reading, posting and replying?
- Assessment activity: are students submitting their assessed work, and are they submitting on time?
You can configure the weighting of each indicator e.g. 60% for logins, 30% for assessment and 10% for forums – depending on the relative importance of these activities in the course. You can also add other indicators such as downloading files.
Limitations and take-up
For institutions using Blackboard or Moodle these tools provide simple ways of viewing engagement by students. It’s surprising that, given how long the VLEs have been in existence, it’s taken so long for such basic reporting facilities to emerge.
As I noted earlier these systems use data from the VLE only; there’s no integration with student information or other systems. None of them appear to facilitate any automated interventions so teachers have to decide what action to take based on the dashboards. As Retention Centre comes bundled with Learn, no additional technical expertise is required to install and maintain this functionality – it merely has to be switched on for a particular course by the instructor. It should be relatively easy for a Moodle administrator to install the plugins.
It’s unclear how widespread the use of these tools is, however many institutions are no doubt experimenting with Retention Centre. One university I spoke to found the interface “ugly” and the functionality not very useful but I’m sure many teachers will find it does give them a better indication of students at risk. Retention Centre is functionality which allows users to try out some basic reporting and analysis, perhaps later leading institutions to consider purchasing the much more sophisticated Blackboard Analytics for Learn or some business intelligence software.
As far as the Moodle tools are concerned Intelliboard claims a few corporate clients on their website – none so far in the UK. It is not clear how many institutions are deploying the plugins but initial response to Engagement Analytics on the Moodle forums is positive and it’s been downloaded nearly 10,000 times from the moodle.org site.
Indicators of engagement
What is particularly of interest about these tools is to what extent this data provides an accurate indication of student engagement – which we know can correlate with measures of success. Michael Feldstein points out that the four Retention Centre indicators for activity in the VLE are considered the most indicative of student success according to the inventor of Purdue’s Course Signals, John Campbell.
But how do we know that the Retention Centre indicators are more accurate than those measuring login, forum and assessment activity in Engagement Analytics? Courses have different types and balances of content, communication and assessment – and this is recognised by the tools in allowing you to customise the indicators. However there are all sorts of other factors at play such as the features of the software itself, alternative ways that students have to communicate, the institutional context and nature of the student body, and to what extent the teacher encourages students to use the tools.
Learning analytics is an inexact science and there will always be individuals who perform differently from how we think they will. Monika Andergassen and her colleagues at the Vienna University of Economics and Business found that there were correlations between time spent in the VLE and final grade, and betweeen self-assessment exercises undertaken and final grade. The correlations in both cases though were modest, and the repeated solving of the same exercises didn’t correlate with better results, implying unsurprisingly that what you do online may be more important than how long you spend in the VLE.
Various people I’ve spoken to at my recent visits to UK institutions believe that the more information we have about students the more accurately we’ll be able to predict their success or likelihood of dropout. A key question is whether adding all the possible sources of data we have will make a significant difference to the accuracy of these predictions. Will a few indicators from the VLE be sufficient to pick up the majority of your students who are at risk or do we need more sophisticated predictive analytics software which also take data from the student information system and elsewhere?
Images are from https://docs.moodle.org/22/en/report/analytics/index and are copyright Kim Edgar, available under the GNU General Public License
2 replies on “Engagement reporting tools for Blackboard and Moodle”
This is a very interesting post, that´s what I was looking for. I´ll study and use Engagement Analytics because I think this one is more wide-ranging.
Thanks for the information.
Greate post. Thank you for sharing with us.